
9.4 KiB
Monitoring Block
Defined in /modules/blocks/monitoring.nix.
This block sets up the monitoring stack for Self Host Blocks. It is composed of:
- Grafana as the dashboard frontend.
- Prometheus as the database for metrics.
- Loki as the database for logs.
Features
- Declarative LDAP Configuration.
- Needed LDAP groups are created automatically.
- Declarative SSO Configuration.
- When SSO is enabled, login with user and password is disabled.
- Registration is enabled through SSO.
- Access through subdomain using reverse proxy.
- Access through HTTPS using reverse proxy.
Usage
The following snippet assumes a few blocks have been setup already:
- the secrets block with SOPS,
- the
shb.sslblock, - the
shb.lldapblock. - the
shb.autheliablock.
{
  shb.monitoring = {
    enable = true;
    subdomain = "grafana";
    inherit domain;
    contactPoints = [ "me@example.com" ];
    adminPassword.result = config.sops.secrets."monitoring/admin_password".result;
    secretKey.result = config.sops.secrets."monitoring/secret_key".result;

      sso = {
        enable = true;
        authEndpoint = "https://${config.shb.authelia.subdomain}.${config.shb.authelia.domain}";

        sharedSecret.result = config.shb.sops.secret.oidcSecret.result;
        sharedSecretForAuthelia.result = config.shb.sops.secret.oidcAutheliaSecret.result;
      };
  };

  shb.sops.secret."monitoring/admin_password".request = config.shb.monitoring.adminPassword.request;
  shb.sops.secret."monitoring/secret_key".request = config.shb.monitoring.secretKey.request;
  shb.sops.secret."monitoring/oidcSecret".request = config.shb.monitoring.sso.sharedSecret.request;
  shb.sops.secret."monitoring/oidcAutheliaSecret" = {
    request = config.shb.monitoring.sso.sharedSecretForAuthelia.request;
    settings.key = "monitoring/oidcSecret";
  };
};
Secrets can be randomly generated with nix run nixpkgs#openssl -- rand -hex 64.
With that, Grafana, Prometheus, Loki and Promtail are setup! You can access Grafana at
grafana.example.com with user admin and the password from the sops key monitoring/admin_password.
The user and admin LDAP groups are created automatically.
SMTP
I recommend adding a STMP server configuration so you receive alerts by email:
shb.monitoring.smtp = {
  from_address = "grafana@$example.com";
  from_name = "Grafana";
  host = "smtp.mailgun.org";
  port = 587;
  username = "postmaster@mg.example.com";
  passwordFile = config.sops.secrets."monitoring/smtp".path;
};

sops.secrets."monitoring/secret_key" = {
  sopsFile = ./secrets.yaml;
  mode = "0400";
  owner = "grafana";
  group = "grafana";
  restartUnits = [ "grafana.service" ];
};
Log Optimization
Since all logs are now stored in Loki, you can probably reduce the systemd journal retention time with:
# See https://www.freedesktop.org/software/systemd/man/journald.conf.html#SystemMaxUse=
services.journald.extraConfig = ''
SystemMaxUse=2G
SystemKeepFree=4G
SystemMaxFileSize=100M
MaxFileSec=day
'';
Other options are accessible through the upstream services modules. You might for example want to update the metrics retention time with:
services.prometheus.retentionTime = "60d";
Provisioning
Self Host Blocks will create automatically the following resources:
- For Grafana:
- datasources
- dashboards
- contact points
- notification policies
- alerts
- For Prometheus, the following exporters and related scrapers:
- node
- smartctl
- nginx
- For Loki, the following exporters and related scrapers:
- systemd
Those resources are namespaced as appropriate under the Self Host Blocks namespace:
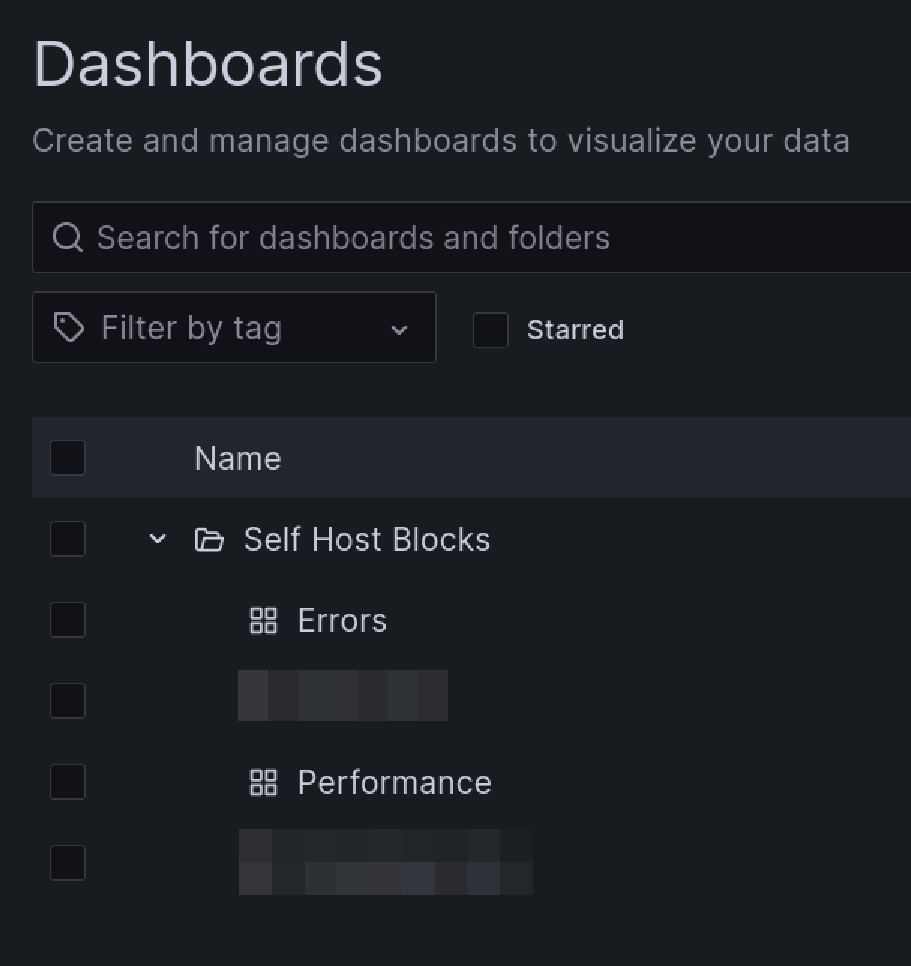
Errors Dashboard
This dashboard is meant to be the first stop to understand why a service is misbehaving.


The yellow and red dashed vertical bars correspond to the Requests Error Budget Alert firing.
Performance Dashboard
This dashboard is meant to be the first stop to understand why a service is performing poorly.


Nextcloud Dashboard
See Nextcloud service manual.
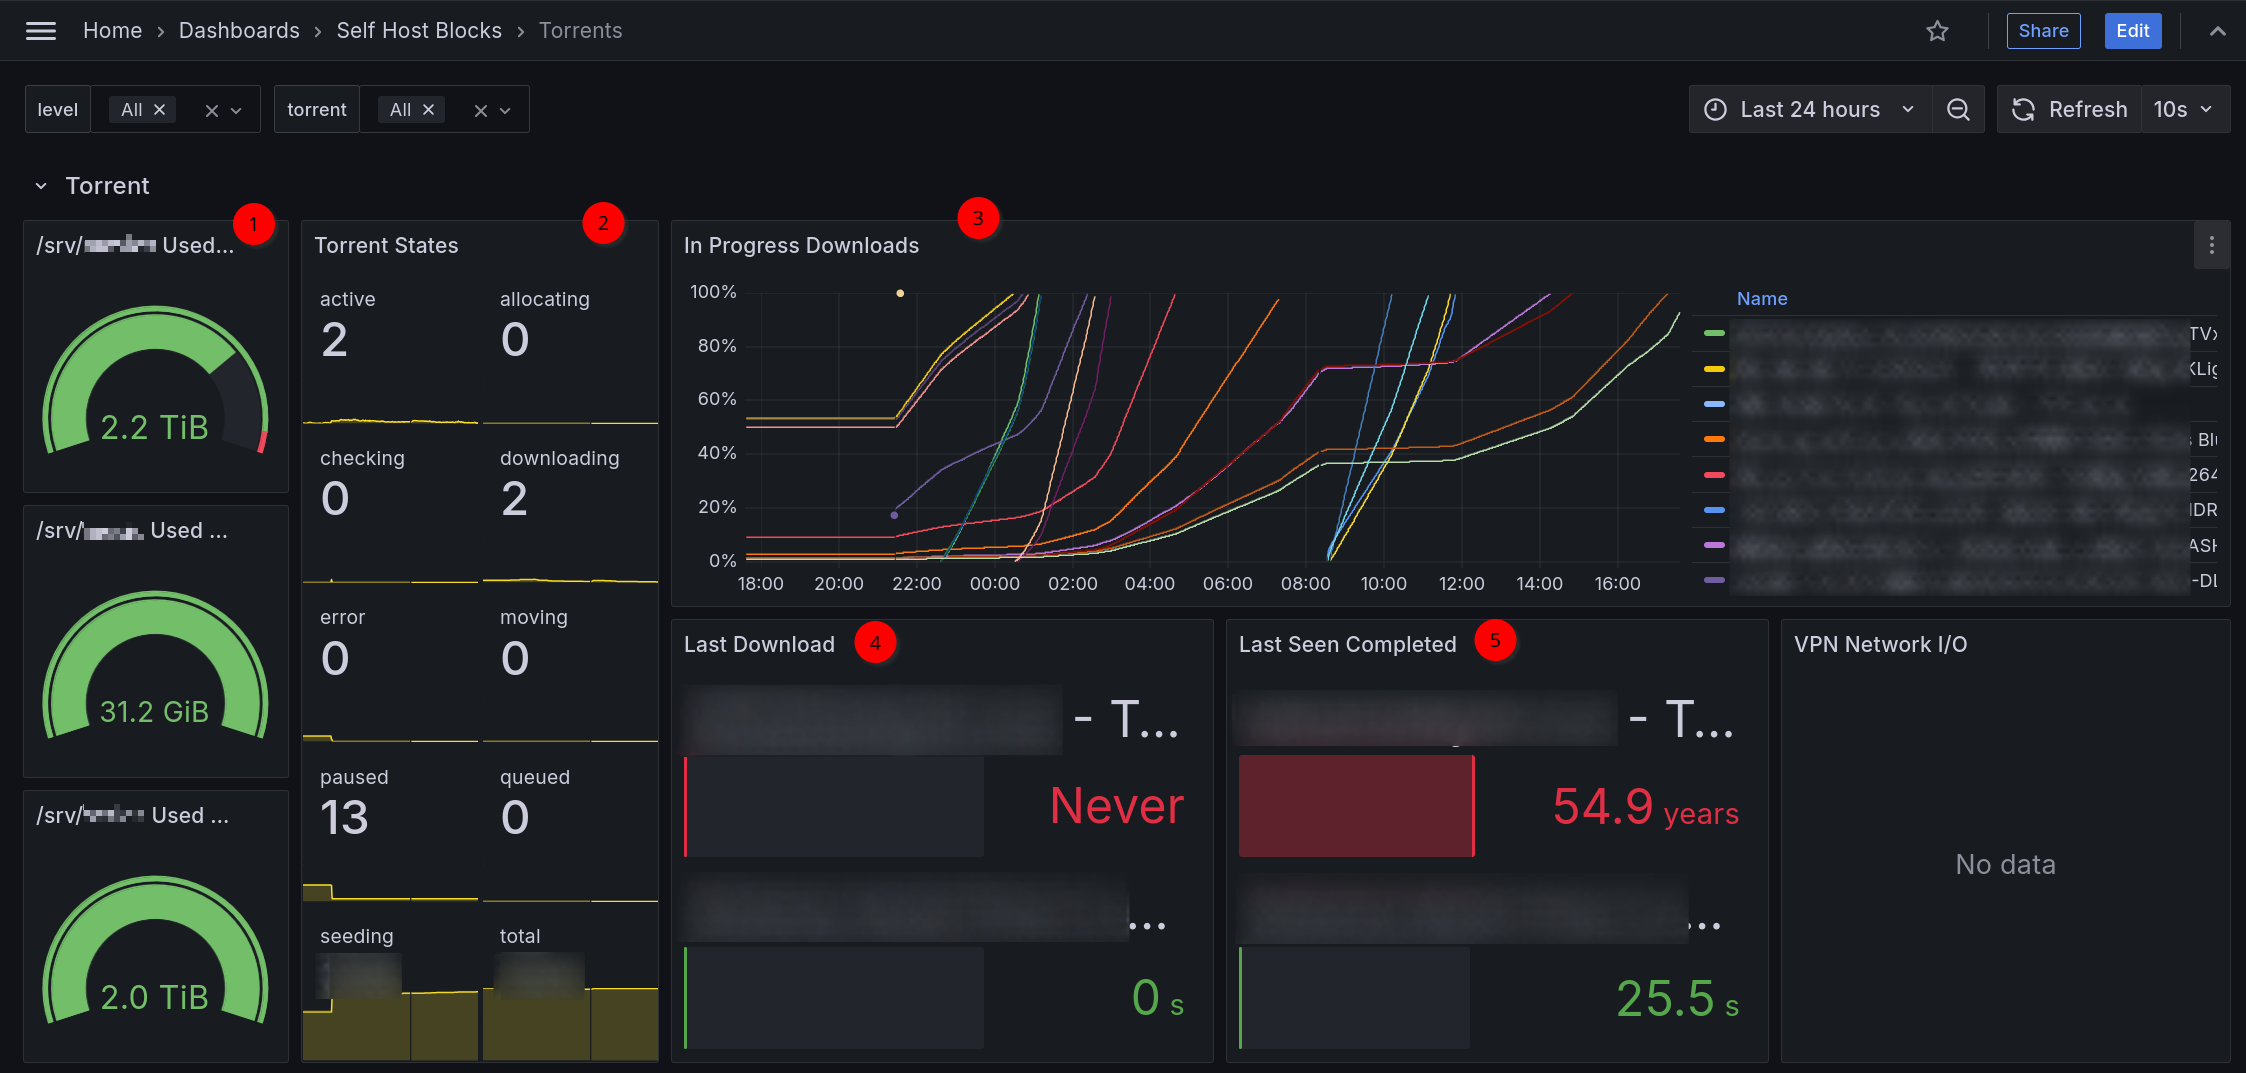
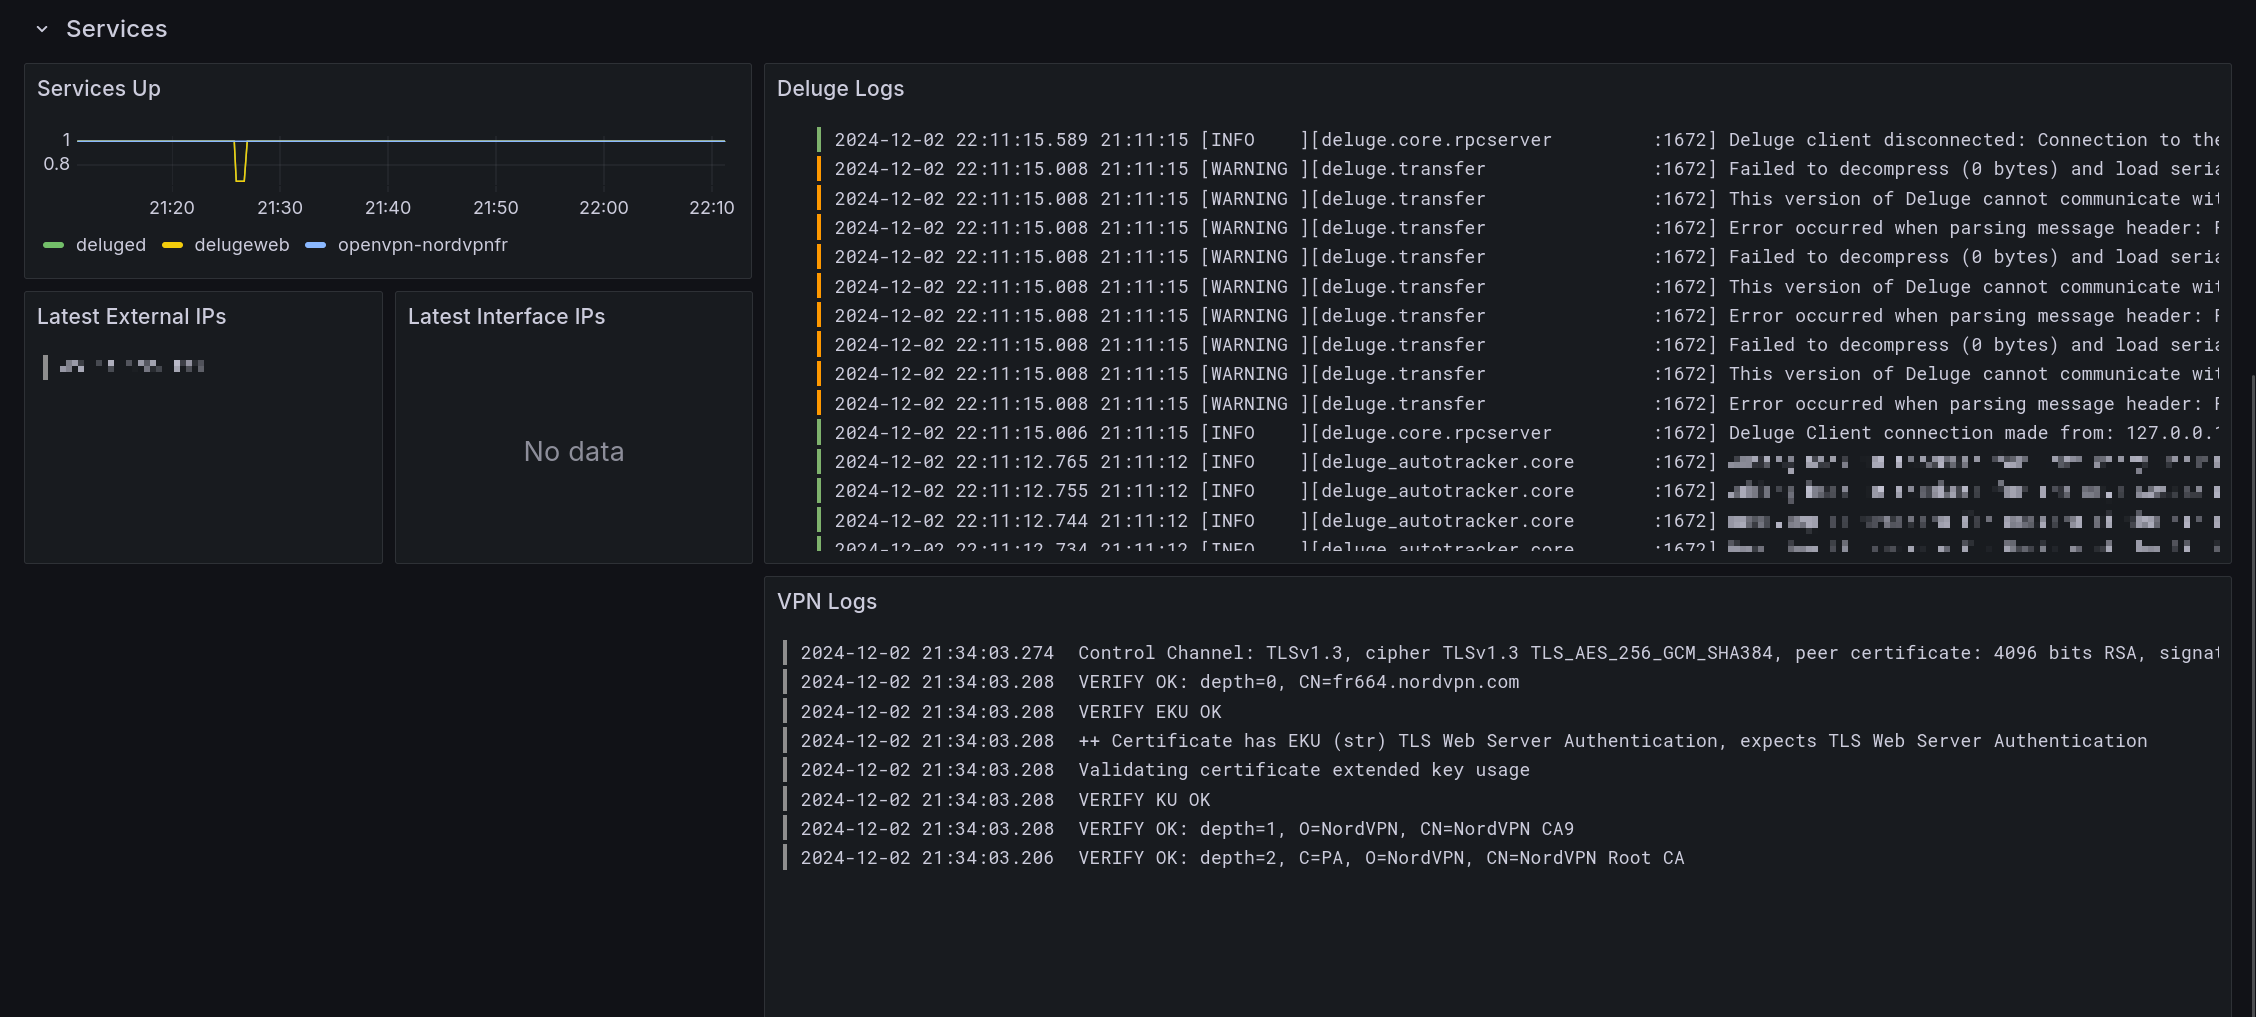
Deluge Dashboard
This dashboard is used to monitor a deluge instance.
Backups Dashboard and Alert
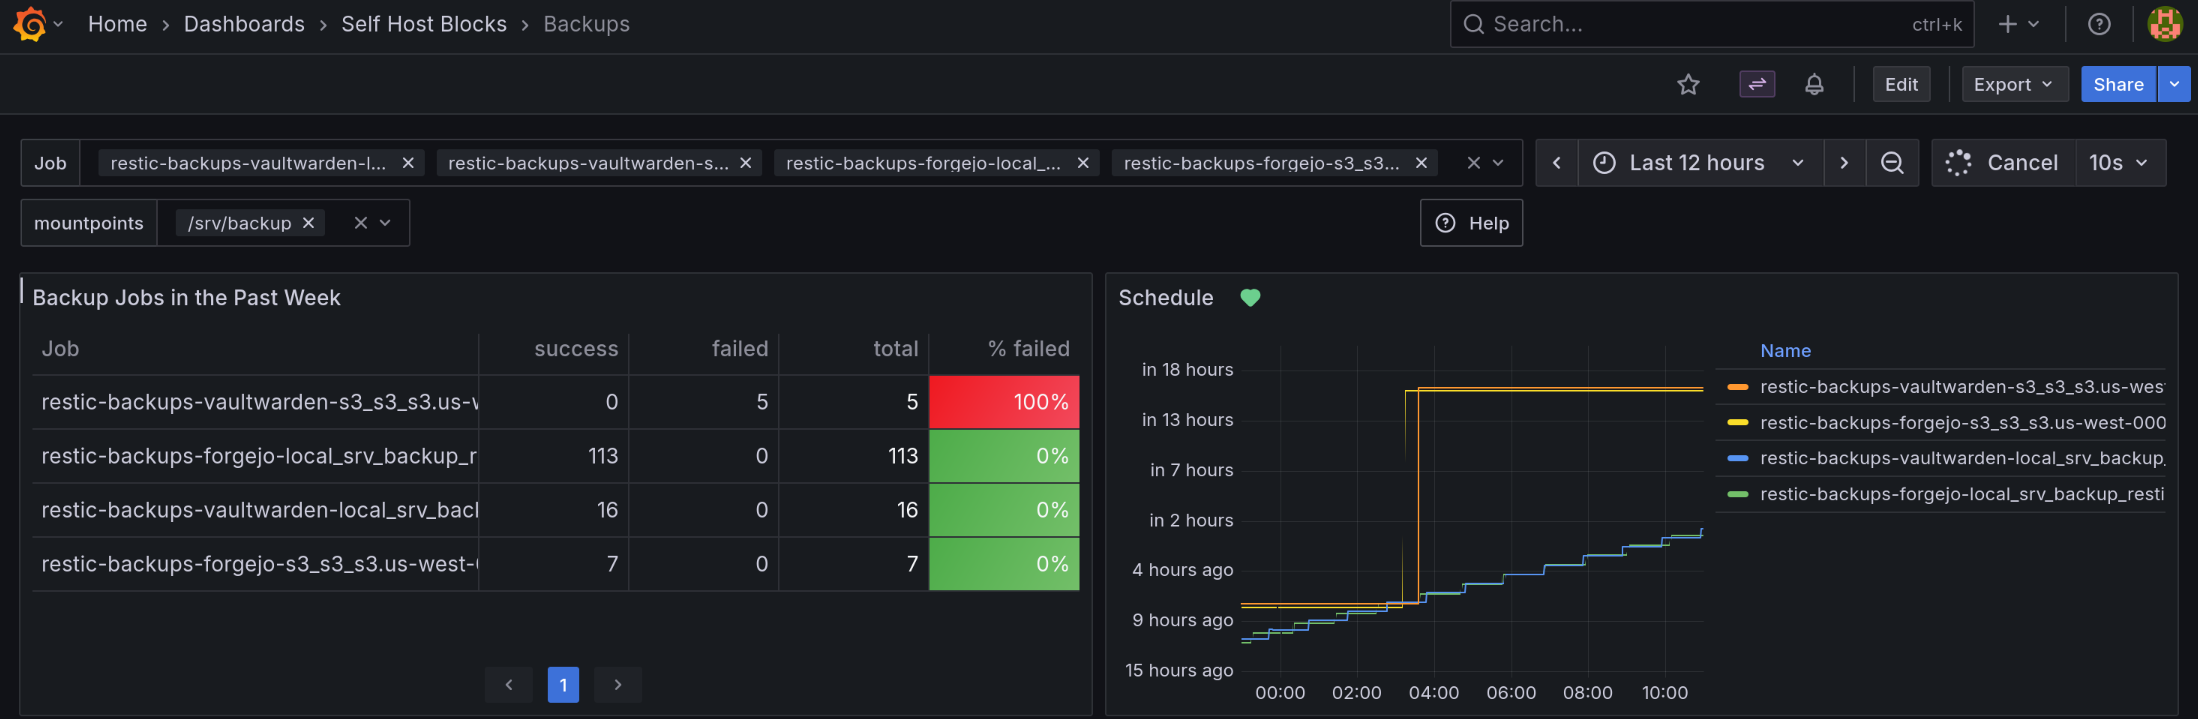
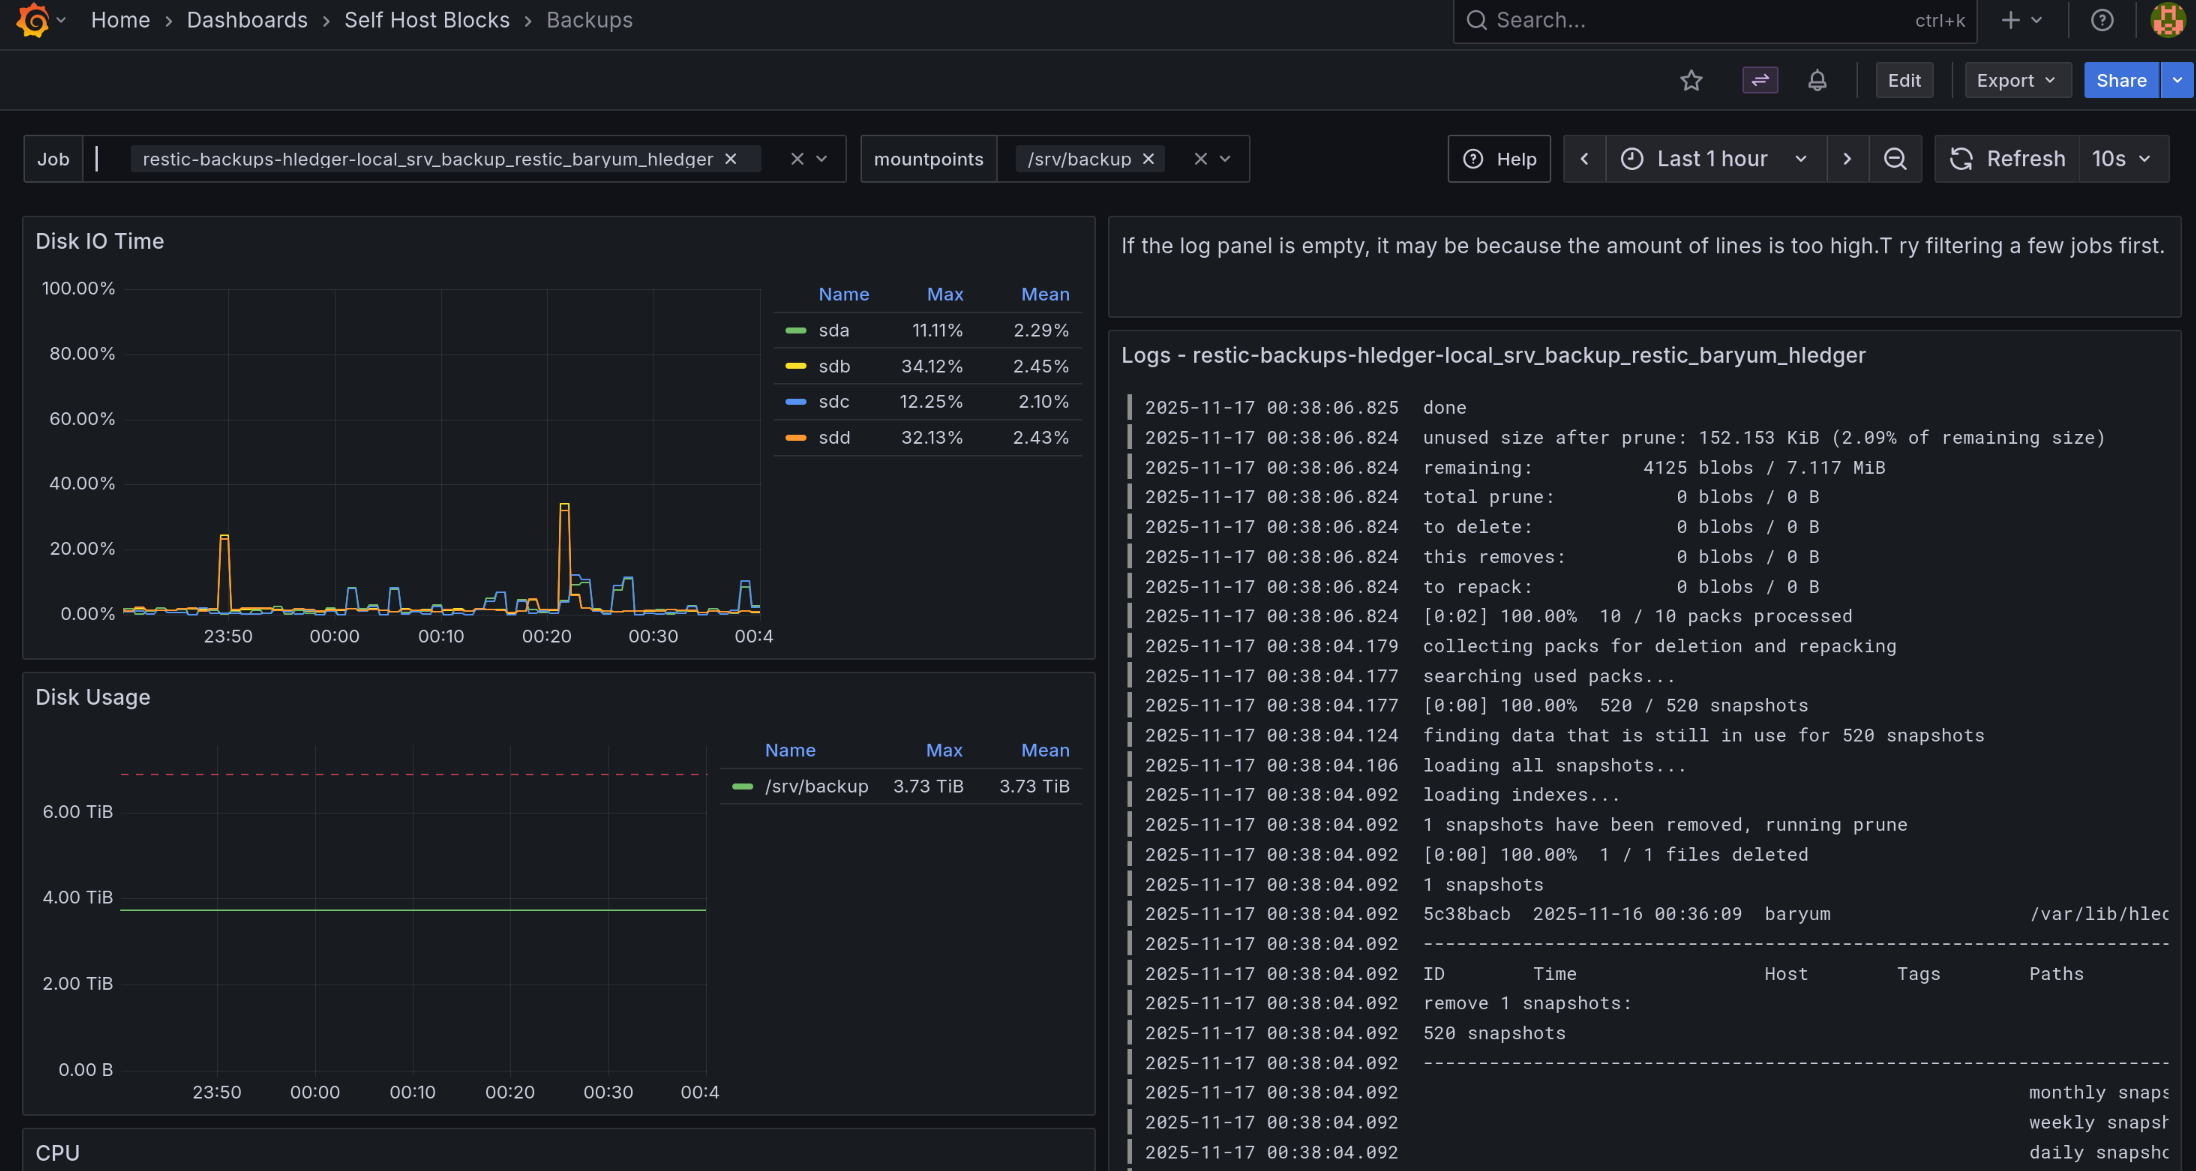
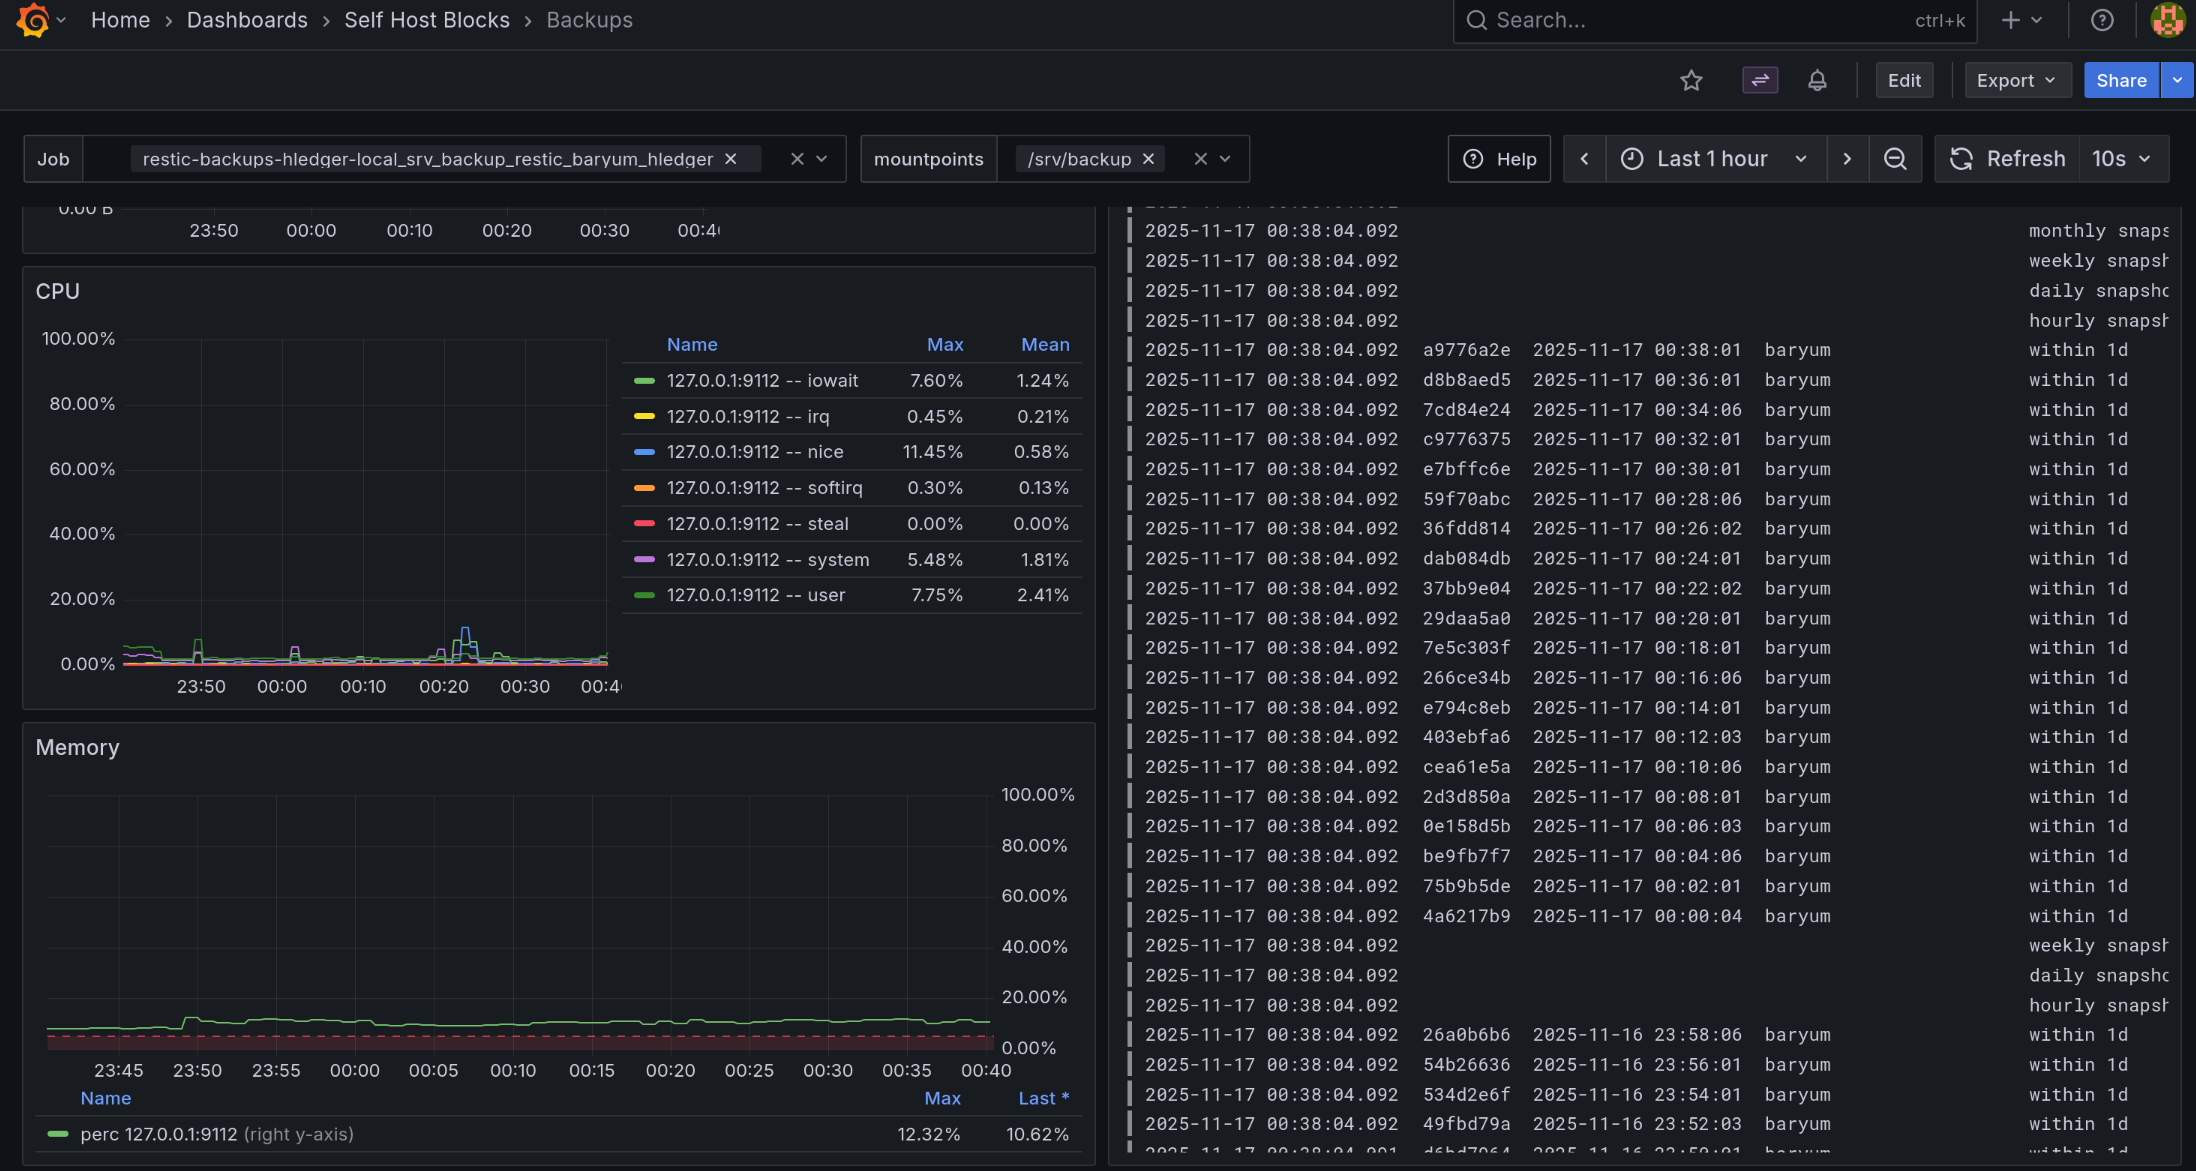
This dashboard shows Restic and BorgBackup backup jobs, or any job with "backup" in the systemd service name.
Dashboard
Variables:
- The "Job" variable allows to select one or more backup jobs. "All" is the default.
- The "mountpoints" variable allows to select only relevant mountpoints for backup. "All" is the default.
The most important graphs are the first three:
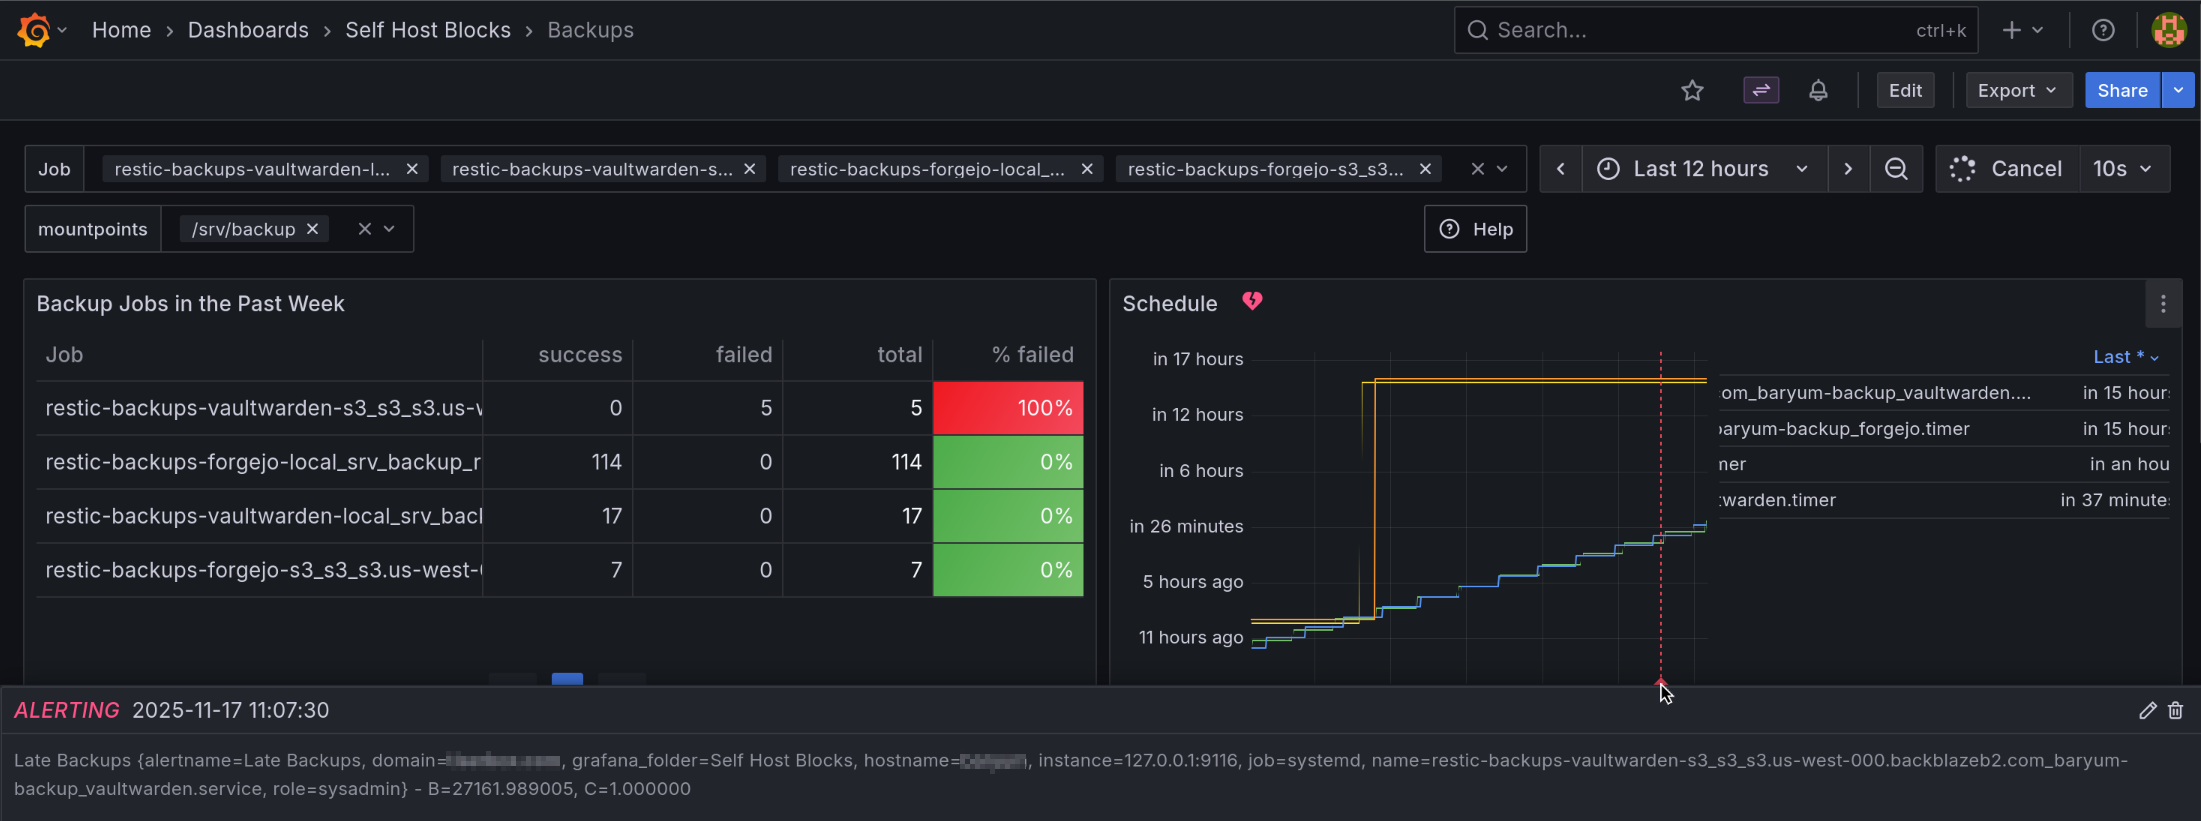
- "Backup Jobs in the Past Week": Shows stats on all backup jobs that ran in the past. It is sorted by the "Failed" column in descending order. This way, one can directly see when a job has failures.
- "Schedule": Shows when a job will run. The unit is "Datetime from Now" meaning it shows when a job ran or will run relative to the current time. An annotation will show up when the "Late Backups" alert fired or resolved.
- "Backup jobs": Shows when a backup job ran. Normally, jobs running for less than 15 seconds will not show up in the graph. We crafted a query that still shows them but the length is 15 seconds, even if the backup job took less time to run.
Alerts
- The "Late Backups" alert will fire if a backup job did not run at all in the last 24 hours or if all runs were failures in the last 24 hours. It will show up as annotations in the "Schedule" panel of the dashboard.

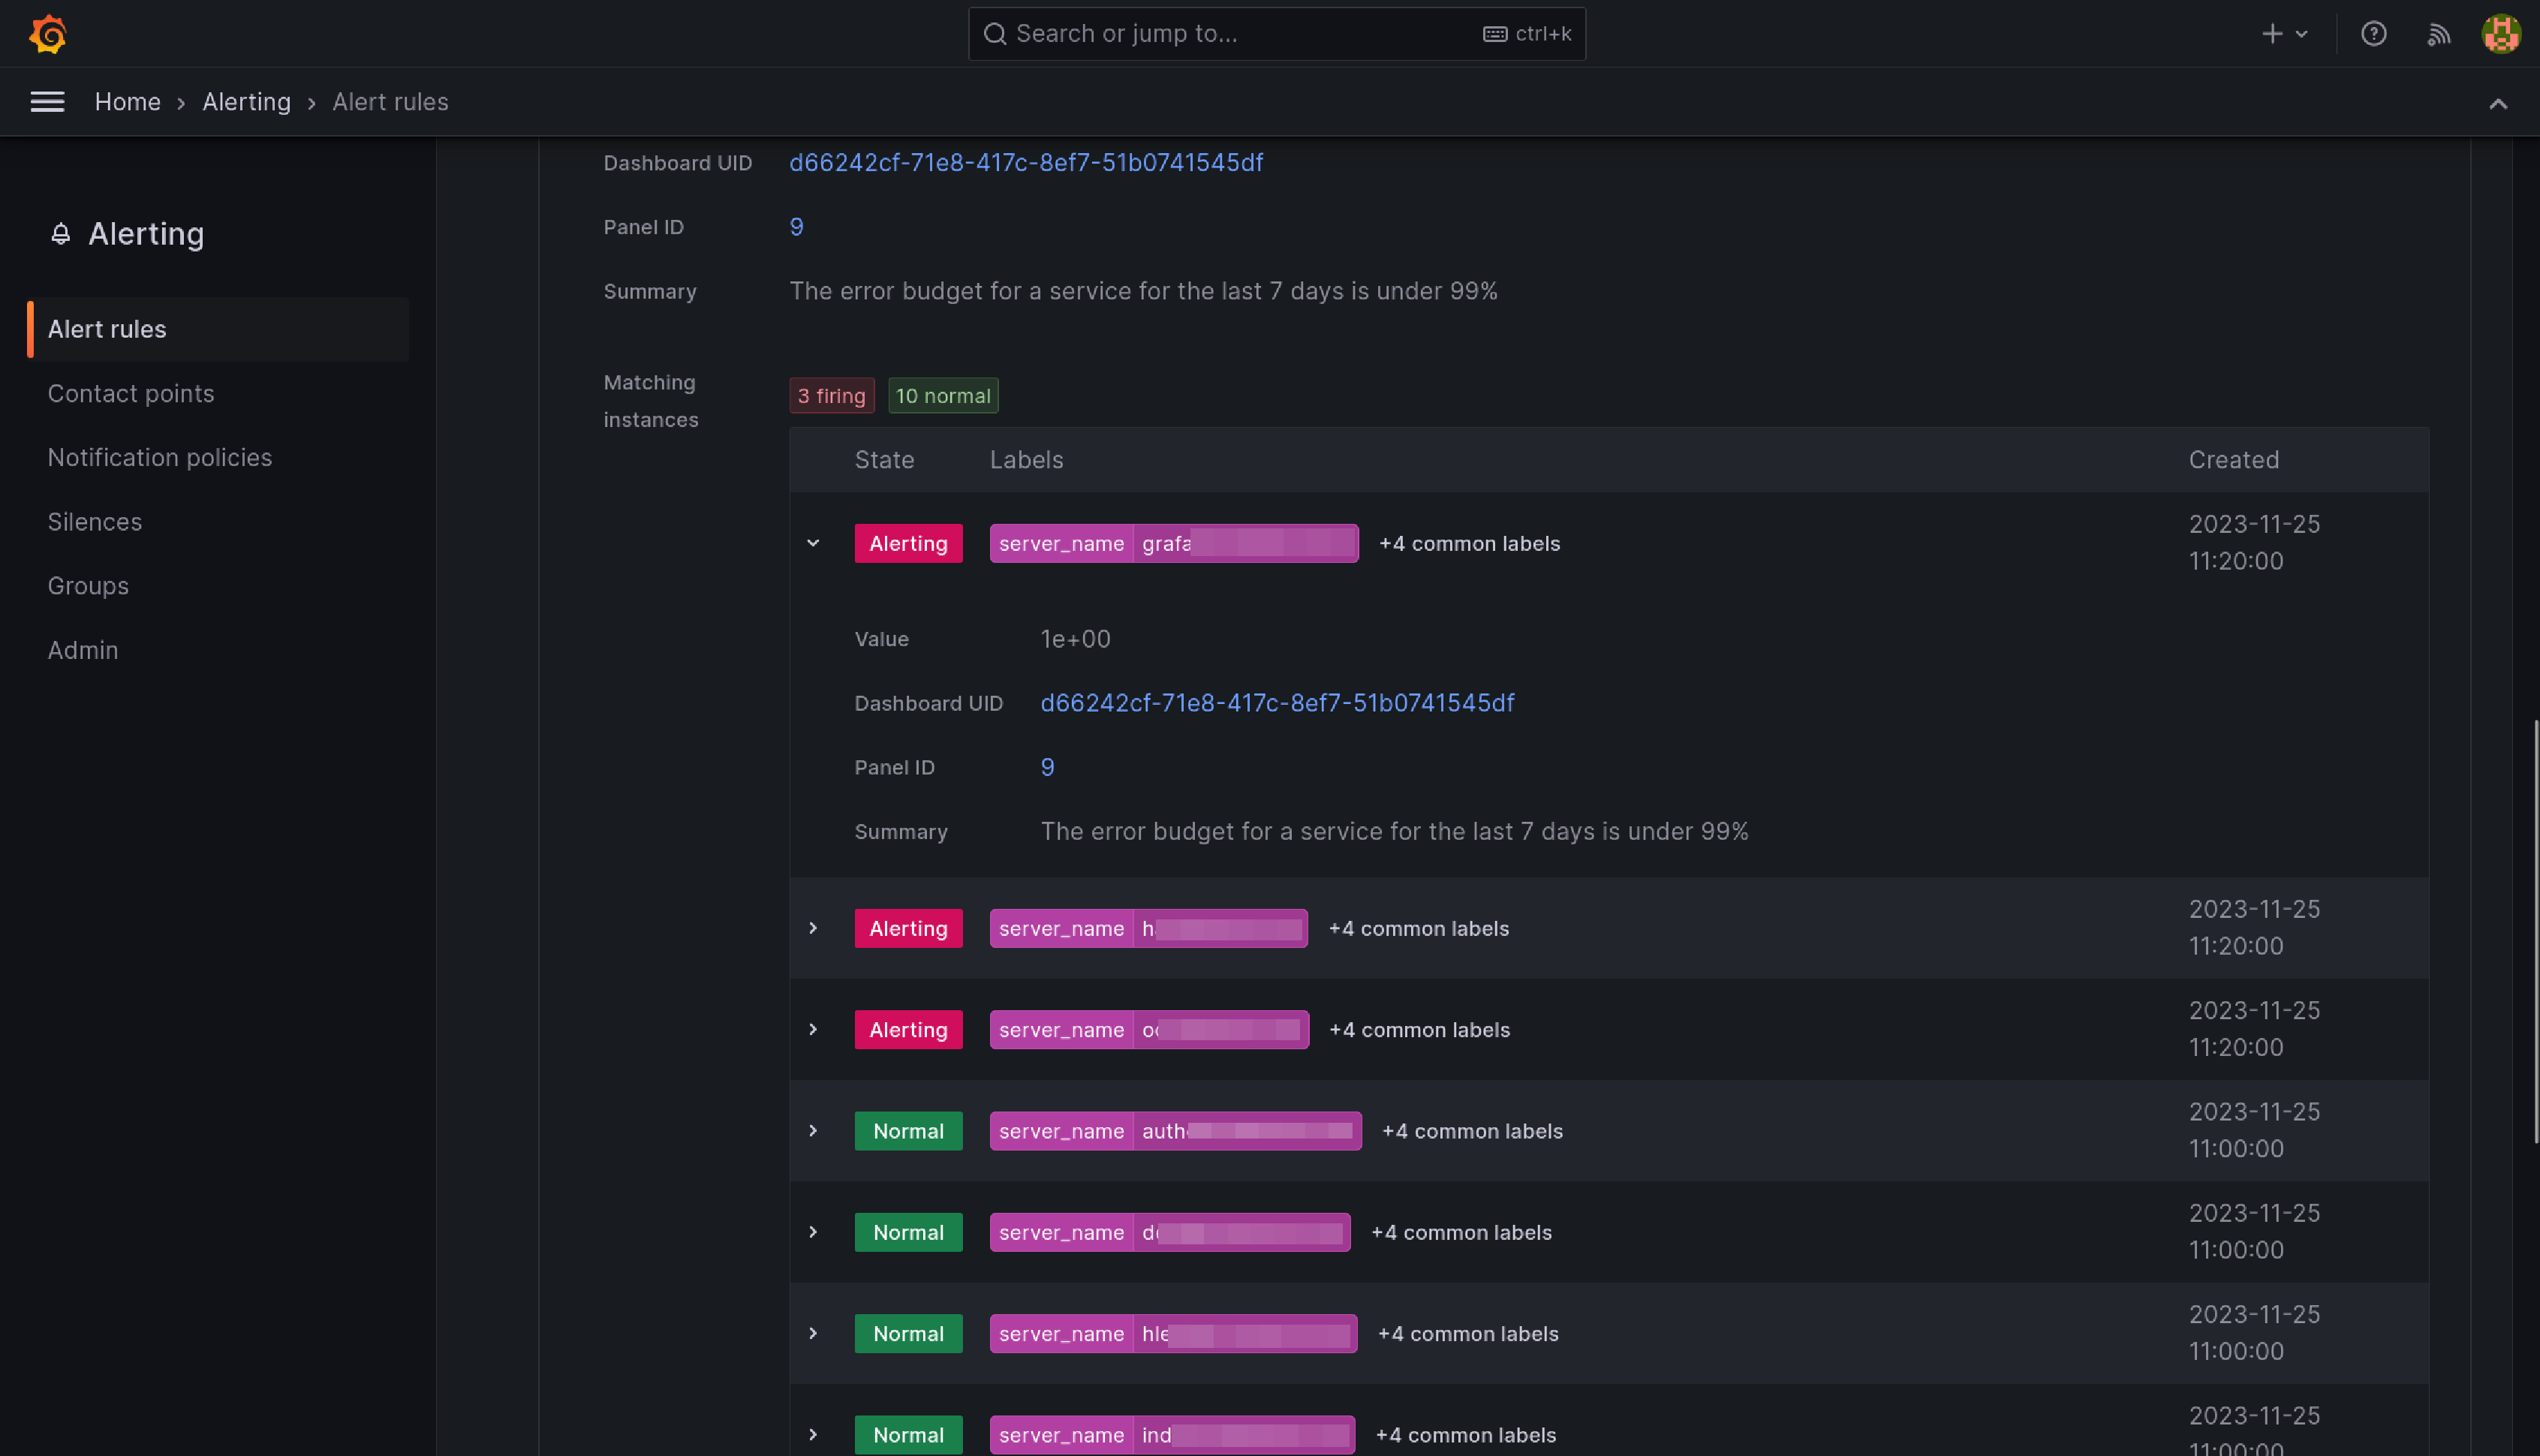
Requests Error Budget Alert
This alert will fire when the ratio between number of requests getting a 5XX response from a service and the total requests to that service exceeds 1%.

SSL Certificates Dashboard and Alert
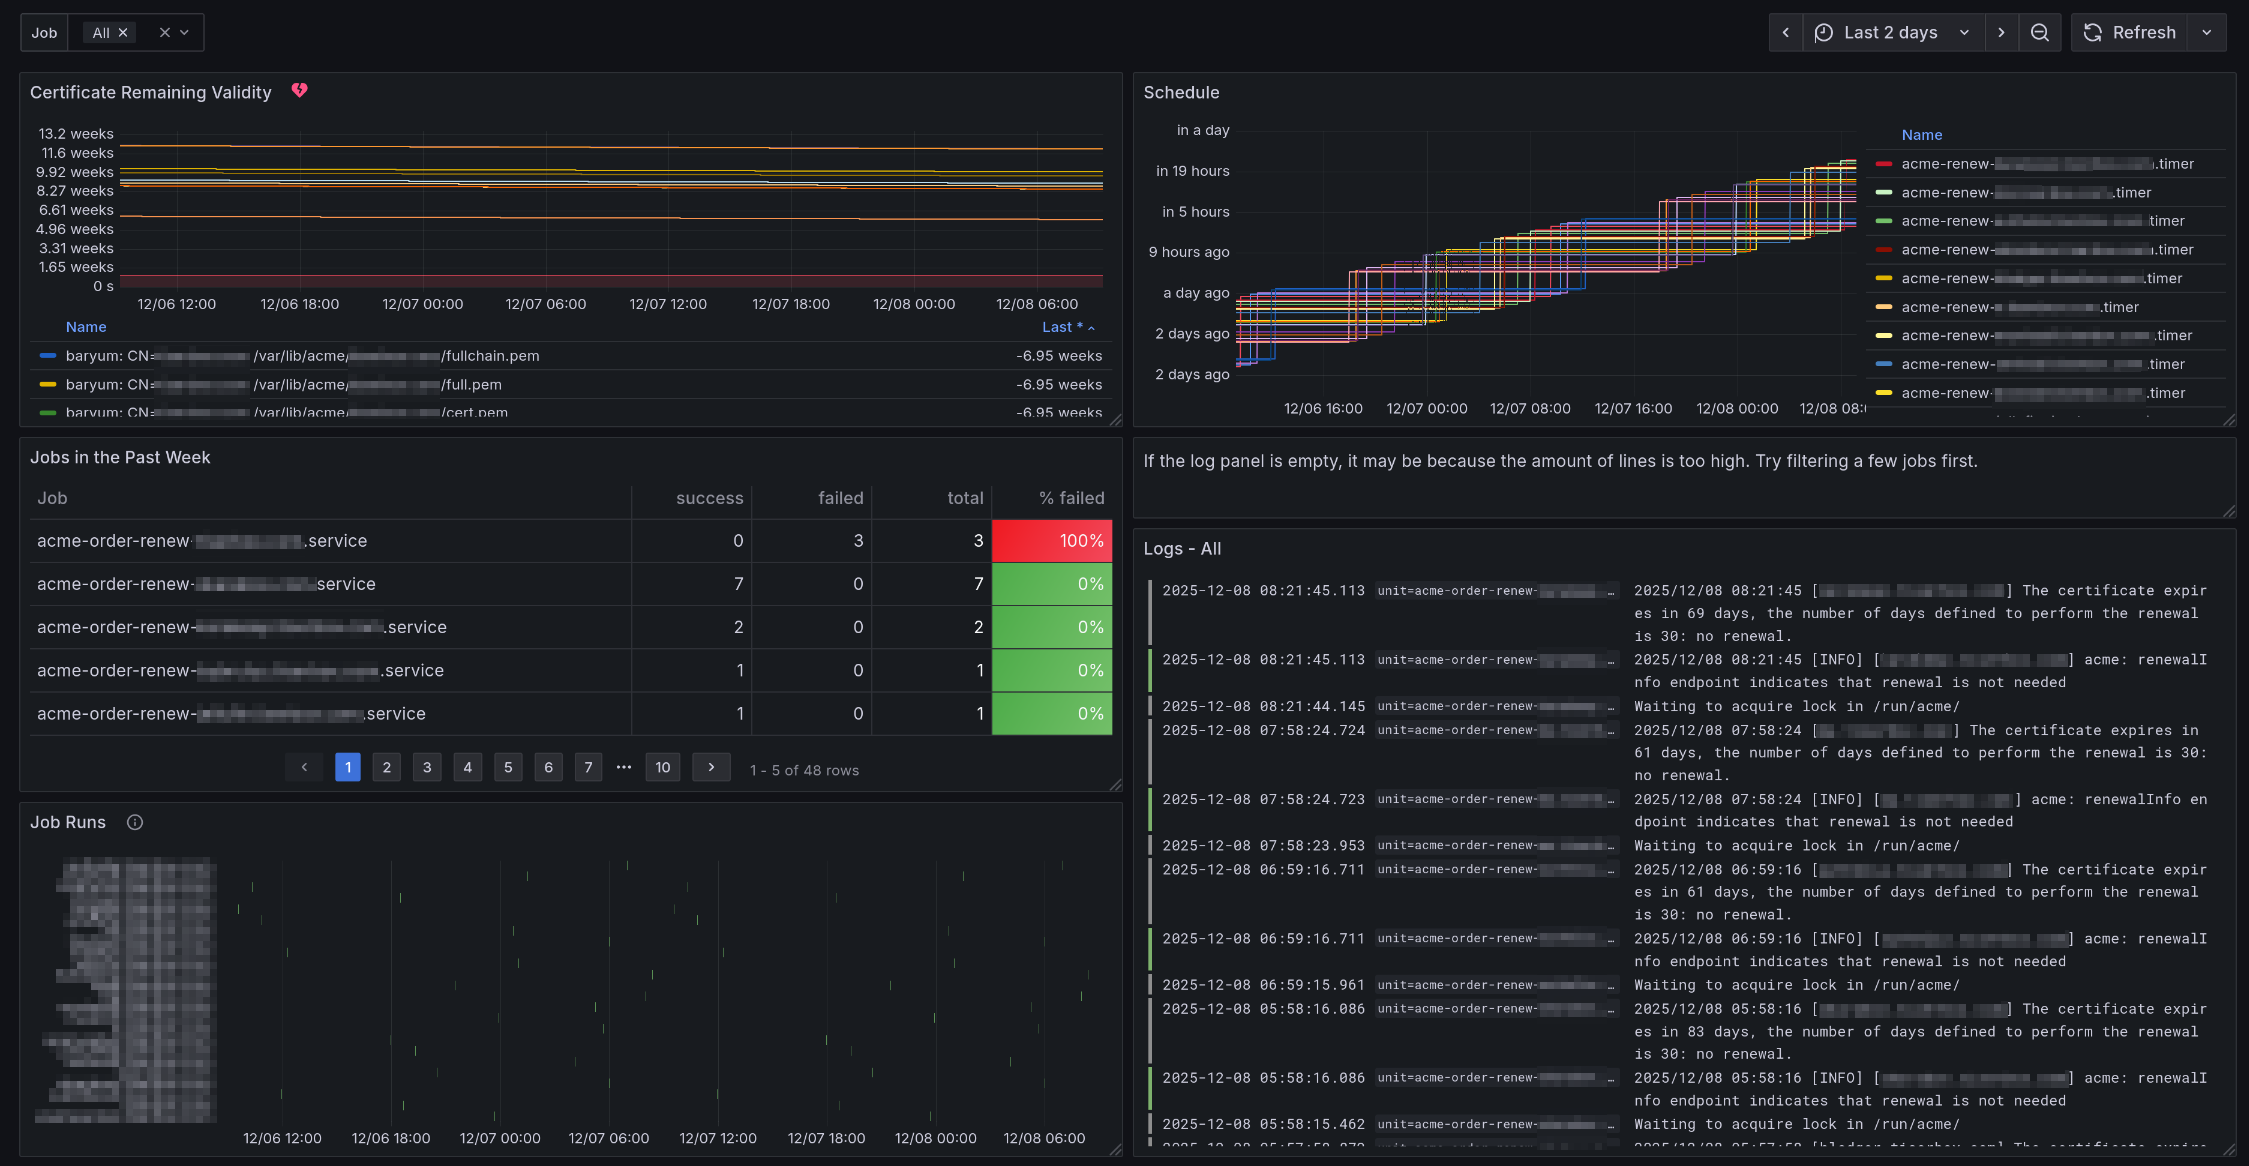
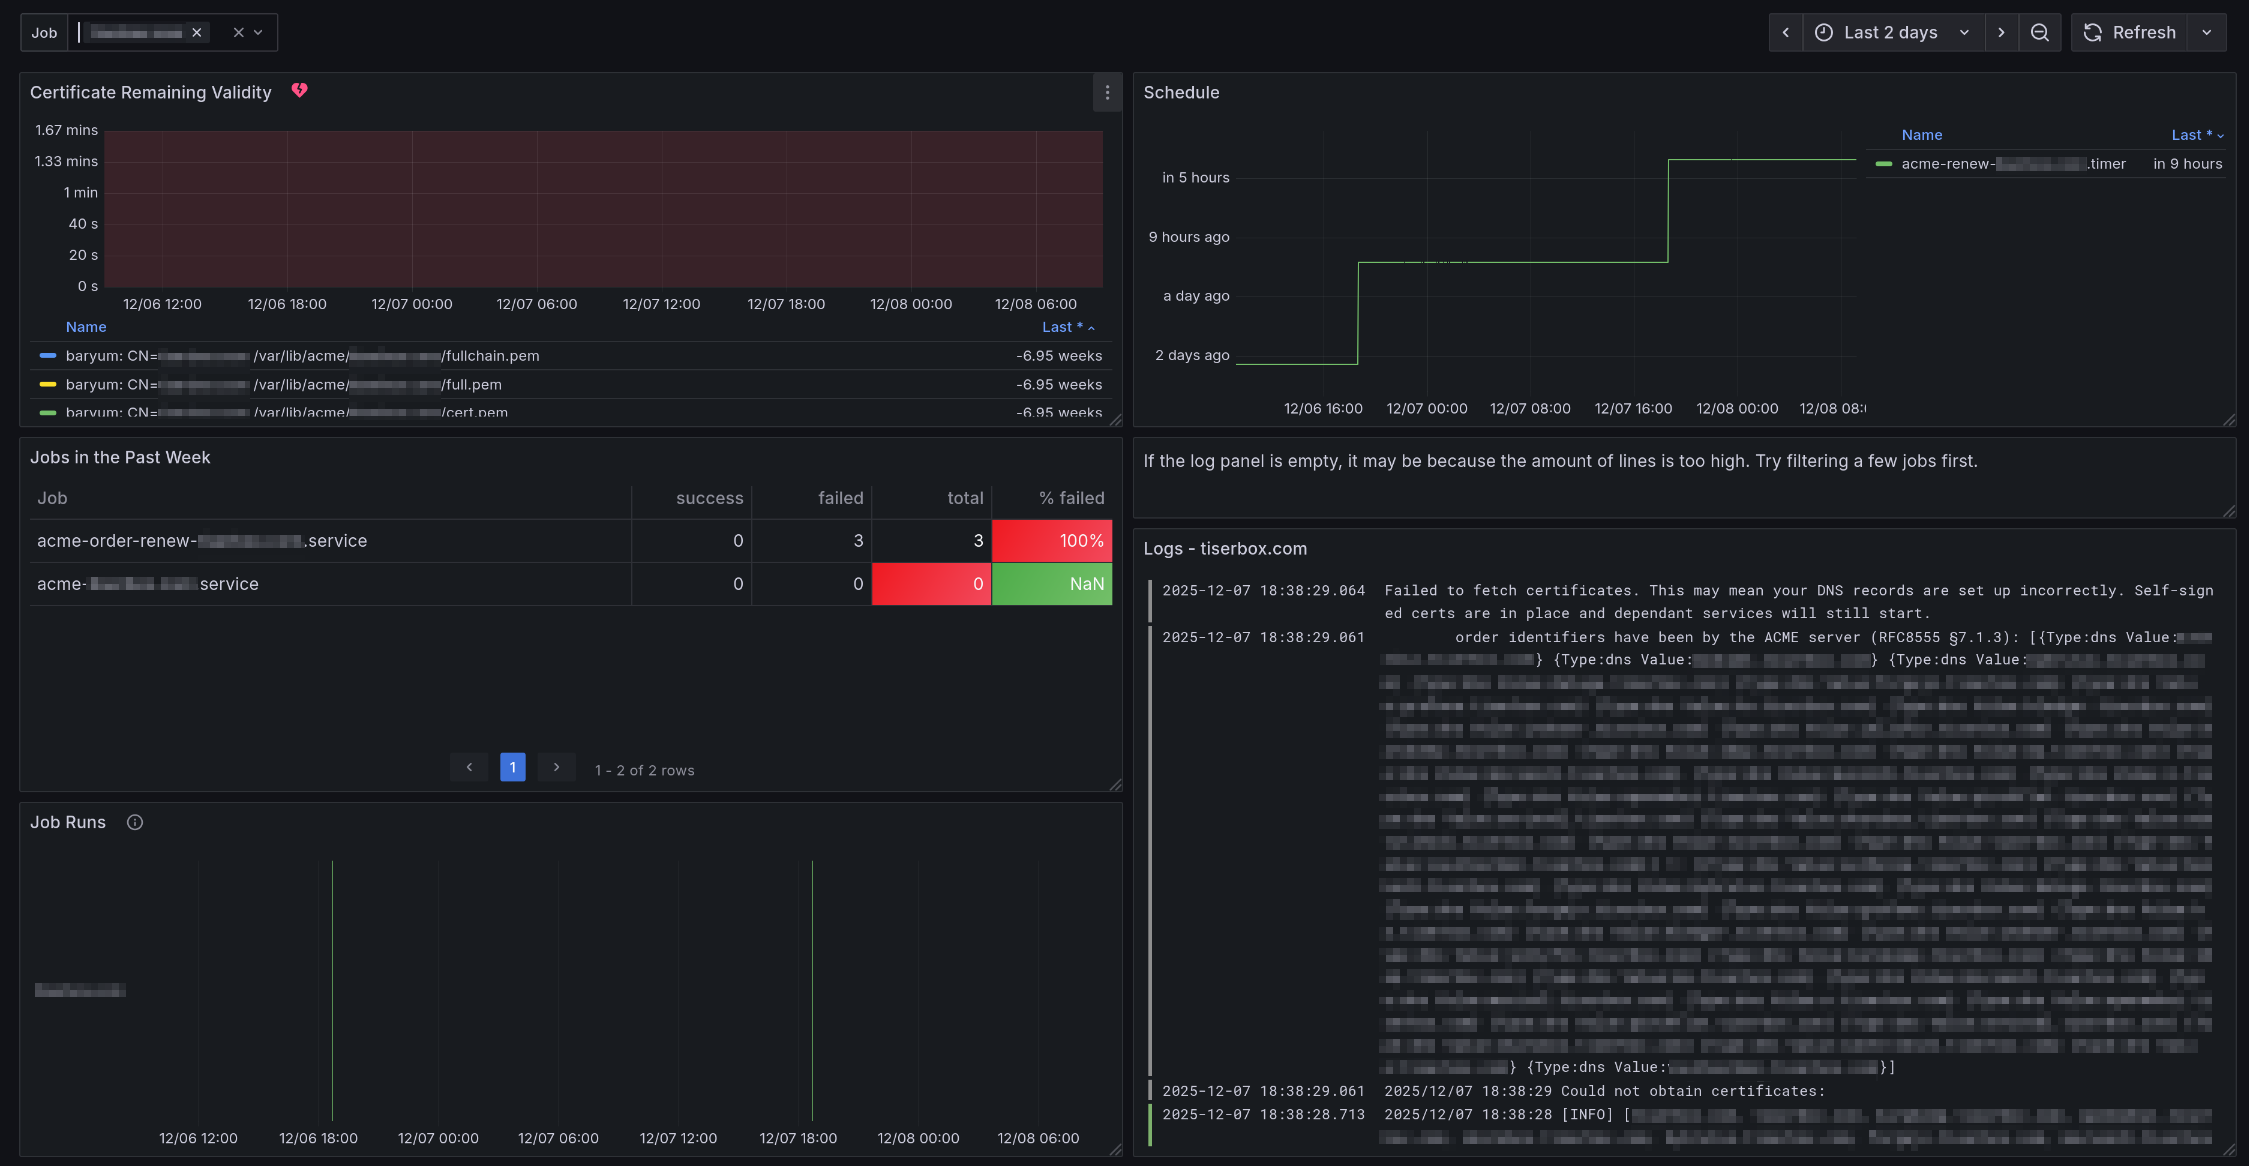
This dashboard shows Let's Encrypt renewal and setup jobs, or any job starting with "acme-" in the systemd service name.
Dashboard
Variables:
- The "Job" variable allows to focus on one or more certificate. "All" is the default.
Graphs:
- "Certificate Remaining Validity": Shows in how long will certificates expire.
It shows all files under
/var/lib/acme. An annotation will show up when the "Certificate Did Not Renew" alert fired or resolved. - "Schedule": Shows when a job will run. The unit is "Datetime from Now" meaning it shows when a job ran or will run relative to the current time.
- "Jobs in the Past Week": Shows stats on all renewal jobs that ran in the past. It is sorted by the "Failed" column in descending order. This way, one can directly see when a job has failures. Note, the stats is not accurate because detecting jobs taking taking less than 15 seconds is not supported well.
- "Job Runs": Shows when a renewal job ran. Normally, jobs running for less than 15 seconds will not show up in the graph. We crafted a query that still shows them but the length is 100 seconds, even if the job took less time to run.
Alerts
- The "Certificate Did Not Renew" alert will fire if a backup job did not run at all in the last 24 hours or if all runs were failures in the last 24 hours. It will show up as annotations in the "Schedule" panel of the dashboard.

Options Reference
id-prefix: blocks-monitoring-options-
list-id: selfhostblocks-blocks-monitoring-options
source: @OPTIONS_JSON@