
4.1 KiB
Monitoring Block
Defined in /modules/blocks/monitoring.nix.
This block sets up the monitoring stack for Self Host Blocks. It is composed of:
- Grafana as the dashboard frontend.
- Prometheus as the database for metrics.
- Loki as the database for logs.
Configuration
shb.monitoring = {
  enable = true;
  subdomain = "grafana";
  inherit domain;
  contactPoints = [ "me@example.com" ];
  adminPassword.result = config.sops.secrets."monitoring/admin_password".result;
  secretKey.result = config.sops.secrets."monitoring/secret_key".result;
};

shb.sops.secret."monitoring/admin_password".request = config.shb.monitoring.adminPassword.request;
shb.sops.secret."monitoring/secret_key".request = config.shb.monitoring.secretKey.request;
With that, Grafana, Prometheus, Loki and Promtail are setup! You can access Grafana at
grafana.example.com with user admin and password ``.
I recommend adding a STMP server configuration so you receive alerts by email:
shb.monitoring.smtp = {
  from_address = "grafana@$example.com";
  from_name = "Grafana";
  host = "smtp.mailgun.org";
  port = 587;
  username = "postmaster@mg.example.com";
  passwordFile = config.sops.secrets."monitoring/smtp".path;
};

sops.secrets."monitoring/secret_key" = {
  sopsFile = ./secrets.yaml;
  mode = "0400";
  owner = "grafana";
  group = "grafana";
  restartUnits = [ "grafana.service" ];
};
Since all logs are now stored in Loki, you can probably reduce the systemd journal retention time with:
# See https://www.freedesktop.org/software/systemd/man/journald.conf.html#SystemMaxUse=
services.journald.extraConfig = ''
SystemMaxUse=2G
SystemKeepFree=4G
SystemMaxFileSize=100M
MaxFileSec=day
'';
Other options are accessible through the upstream services modules. You might for example want to update the metrics retention time with:
services.prometheus.retentionTime = "60d";
Provisioning
Self Host Blocks will create automatically the following resources:
- For Grafana:
- datasources
- dashboards
- contact points
- notification policies
- alerts
- For Prometheus, the following exporters and related scrapers:
- node
- smartctl
- nginx
- For Loki, the following exporters and related scrapers:
- systemd
Those resources are namespaced as appropriate under the Self Host Blocks namespace:
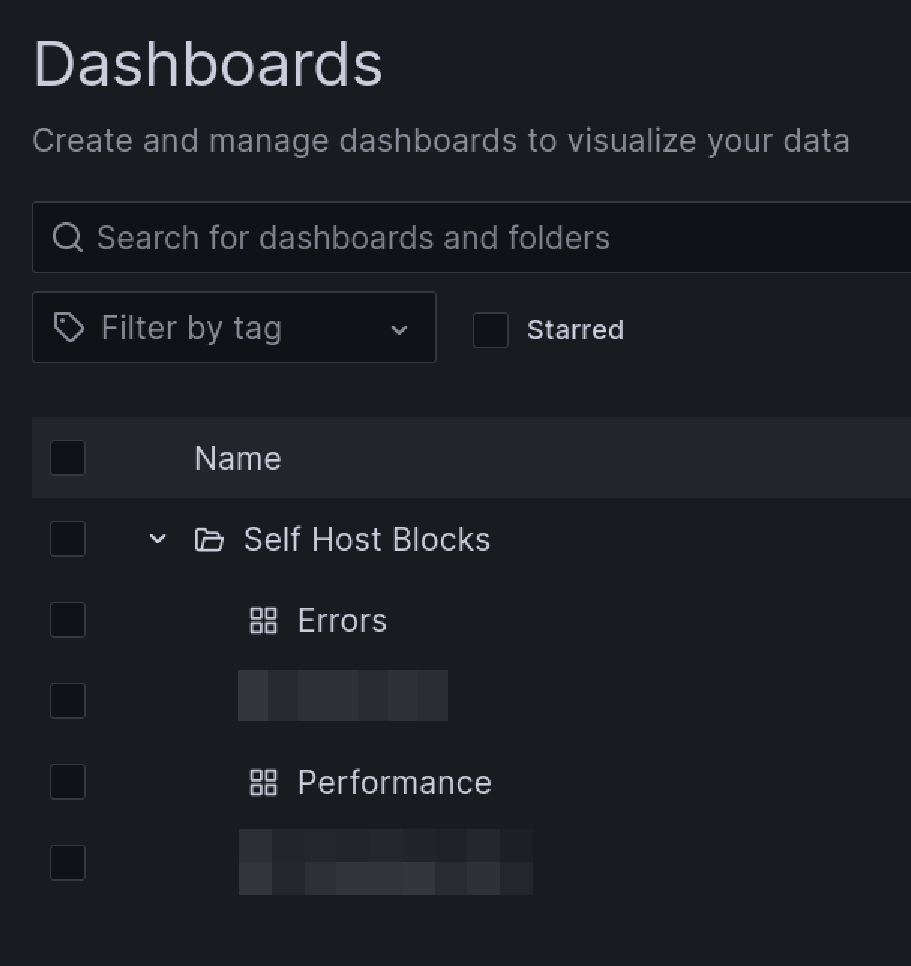
Errors Dashboard
This dashboard is meant to be the first stop to understand why a service is misbehaving.

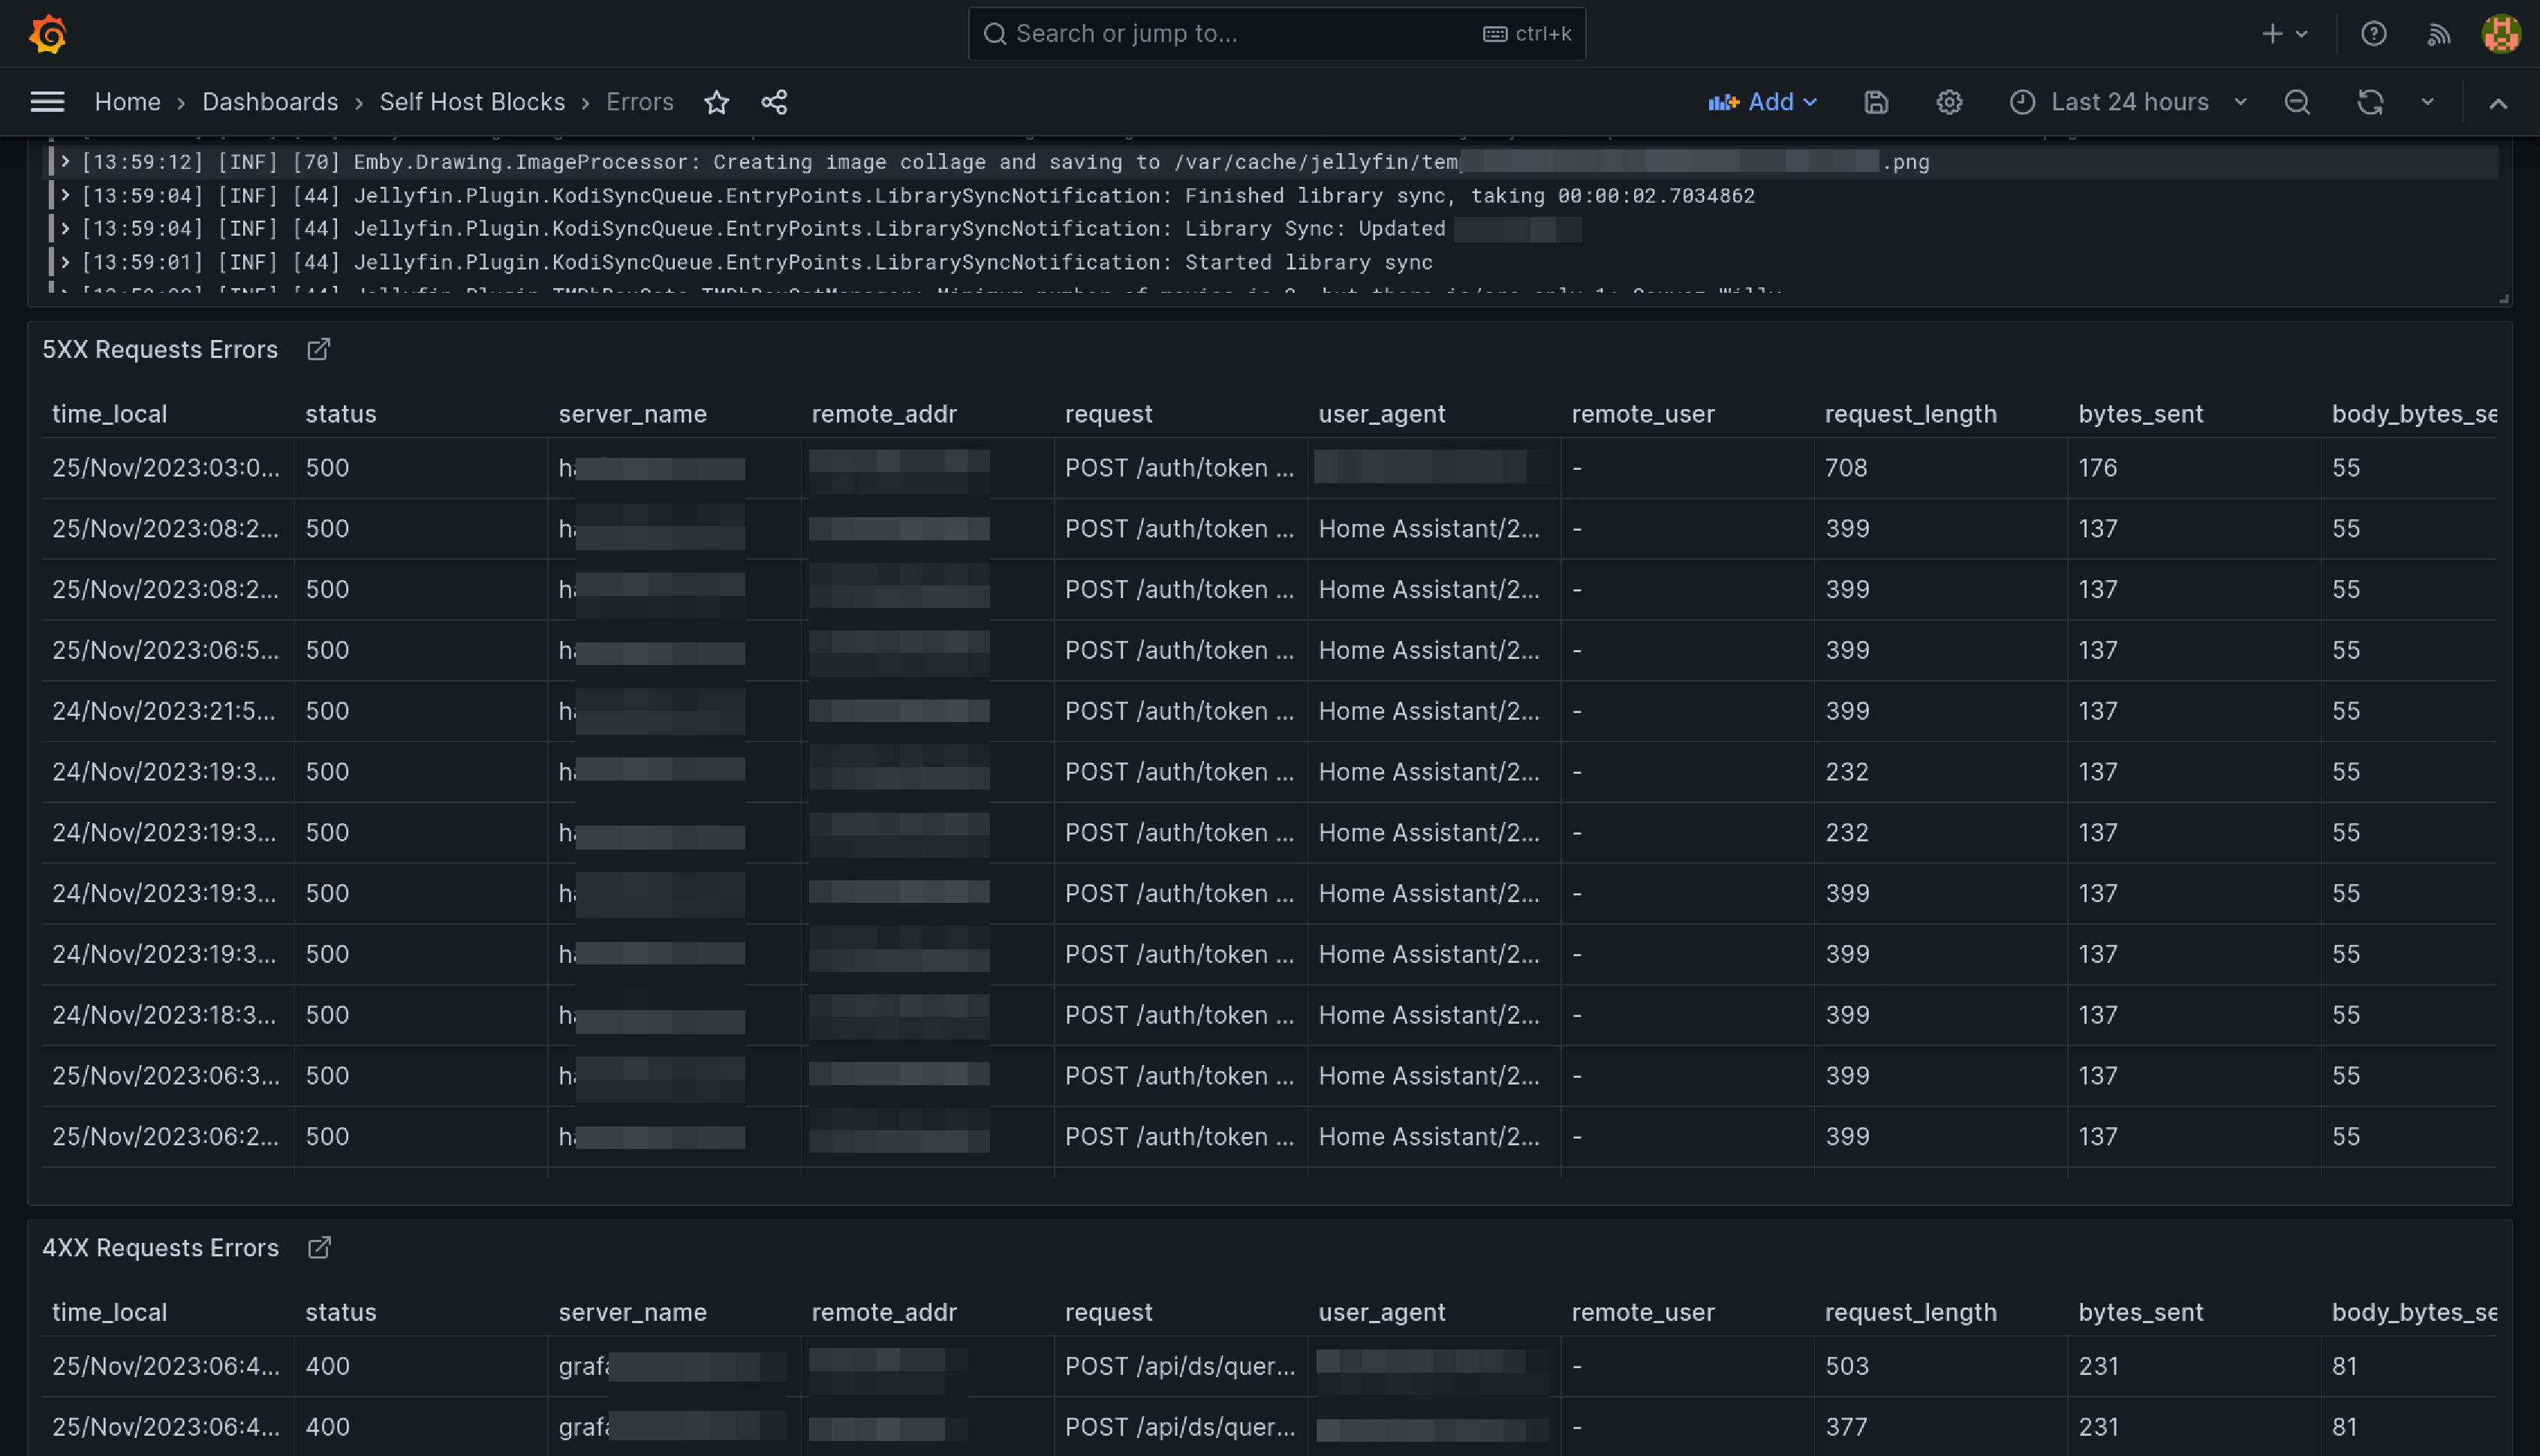
The yellow and red dashed vertical bars correspond to the Requests Error Budget Alert firing.
Performance Dashboard
This dashboard is meant to be the first stop to understand why a service is performing poorly.
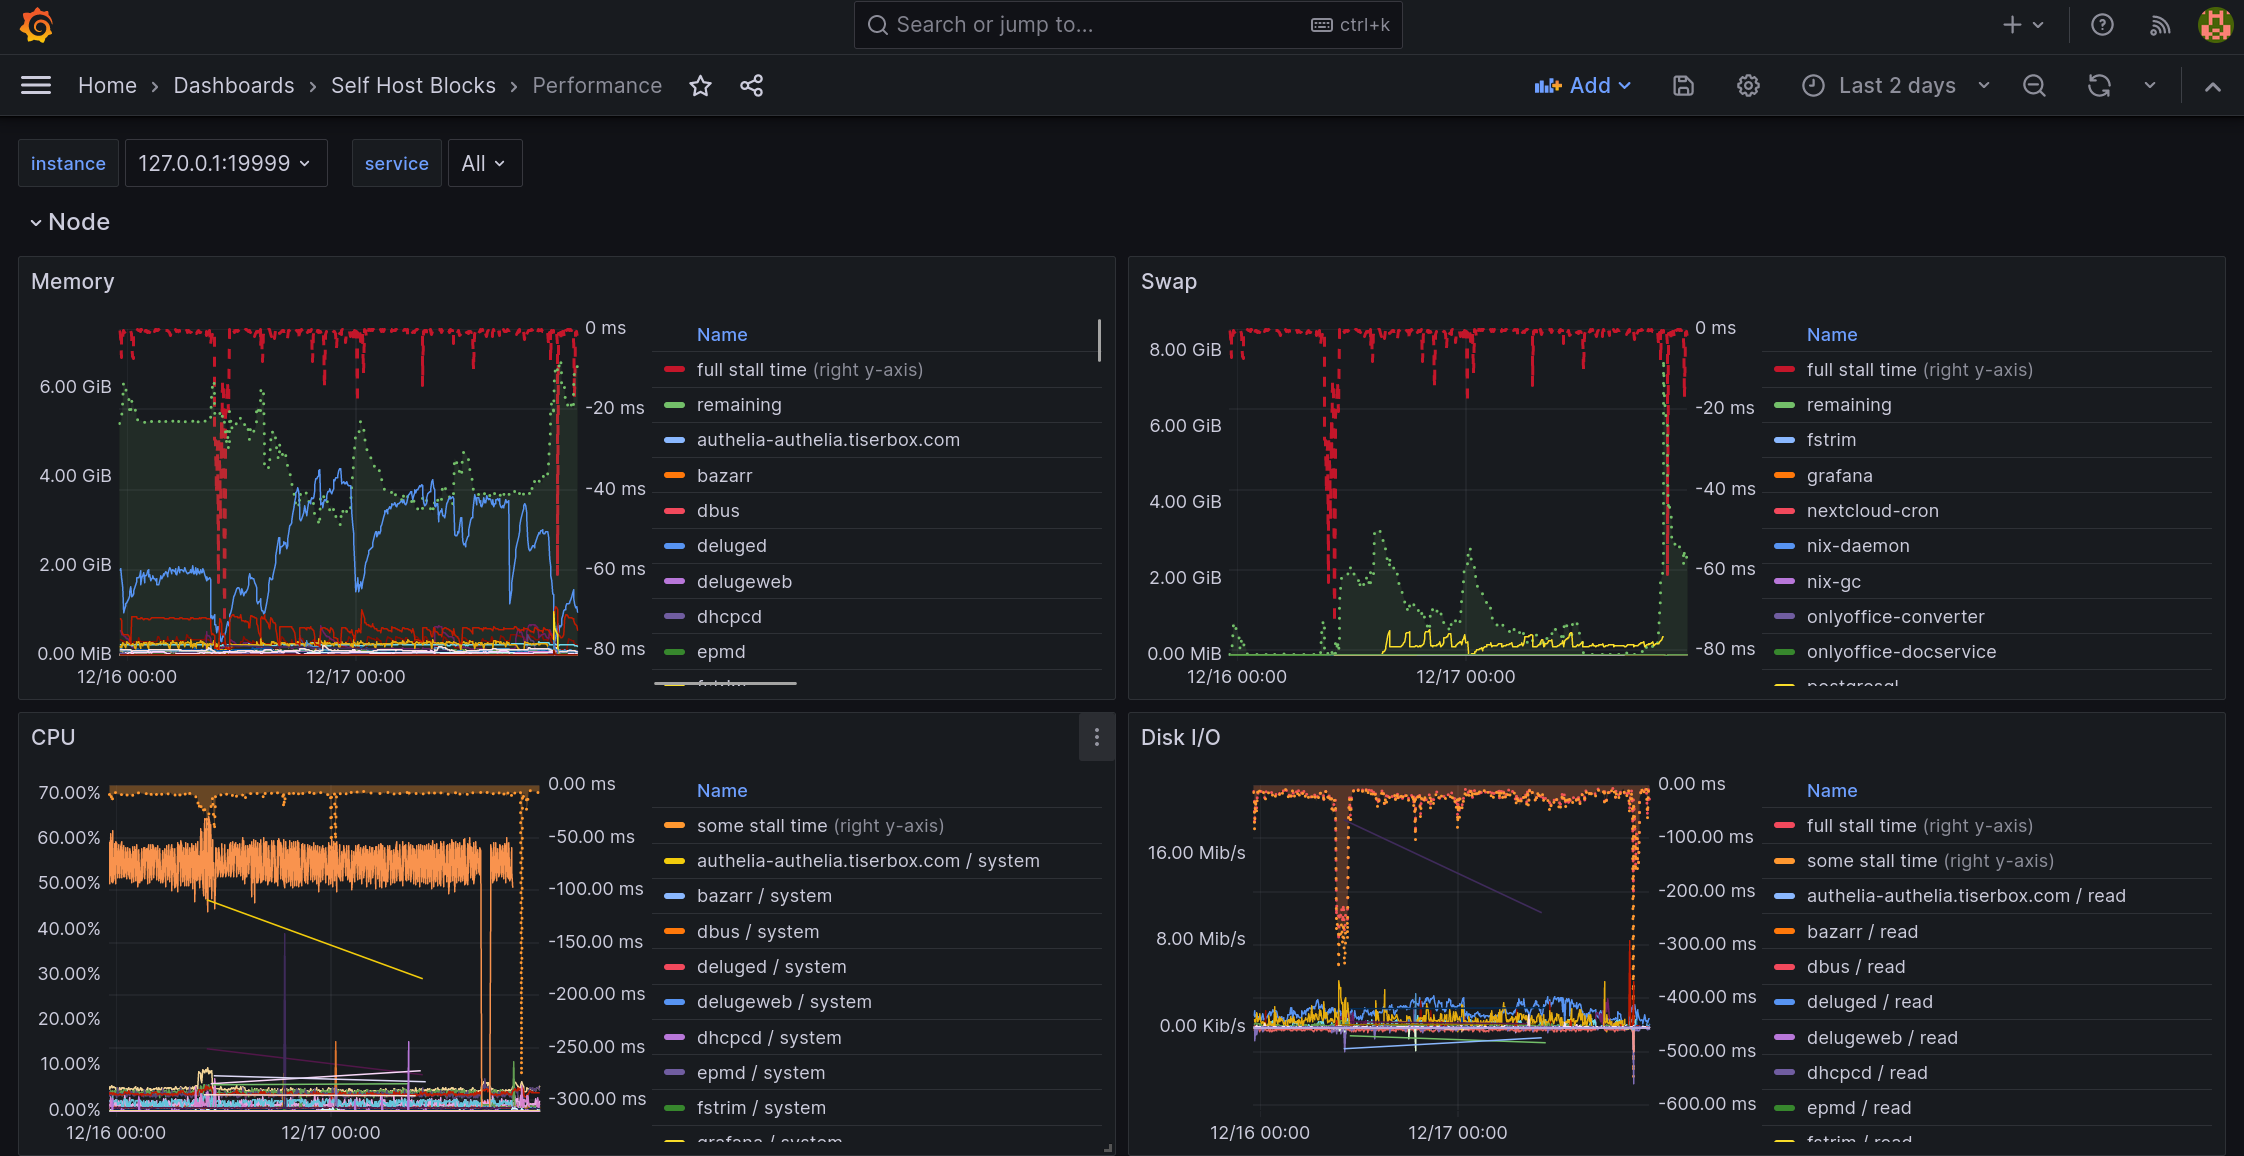


Nextcloud Dashboard
See Nextcloud service manual.
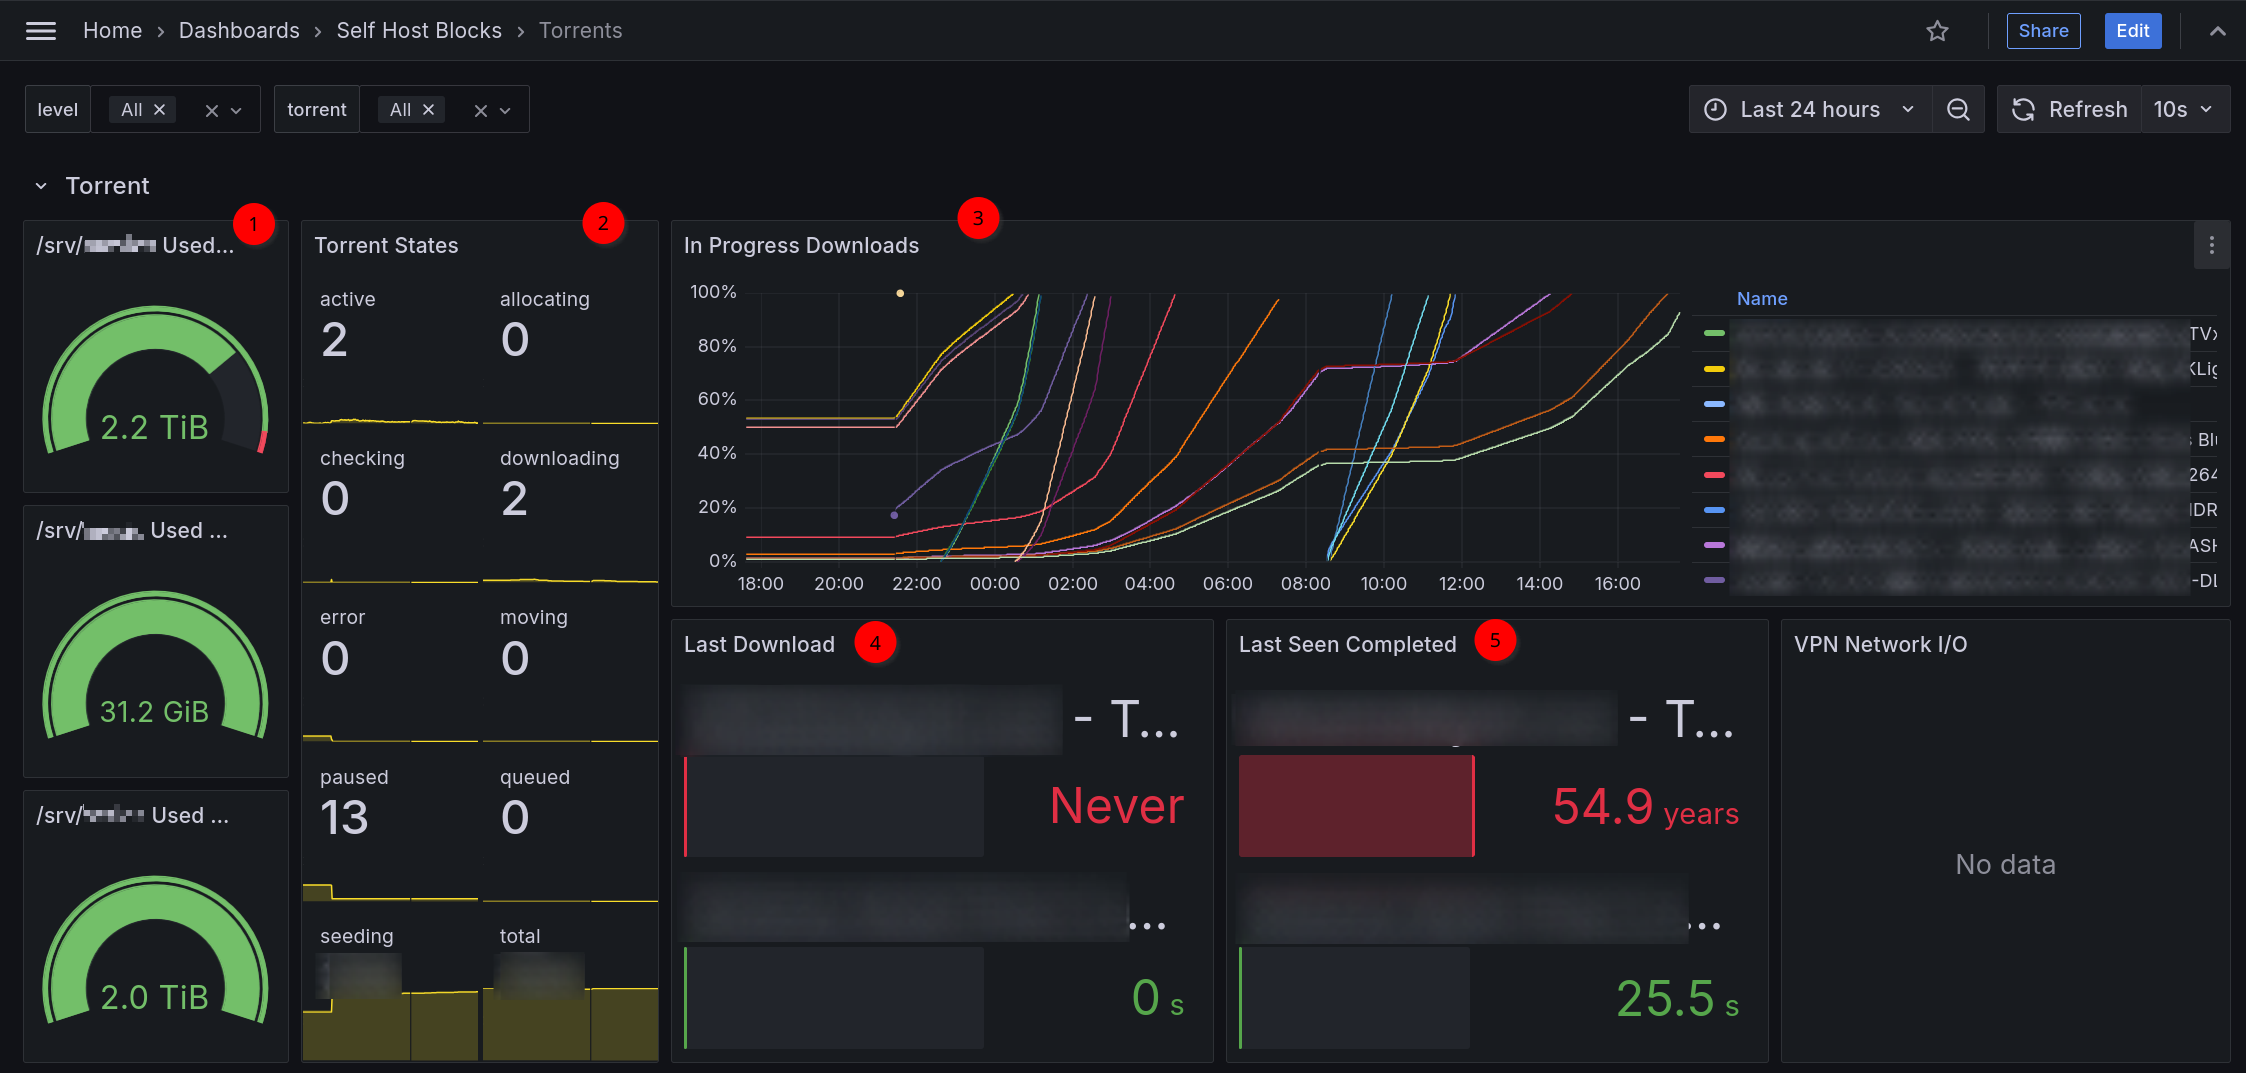
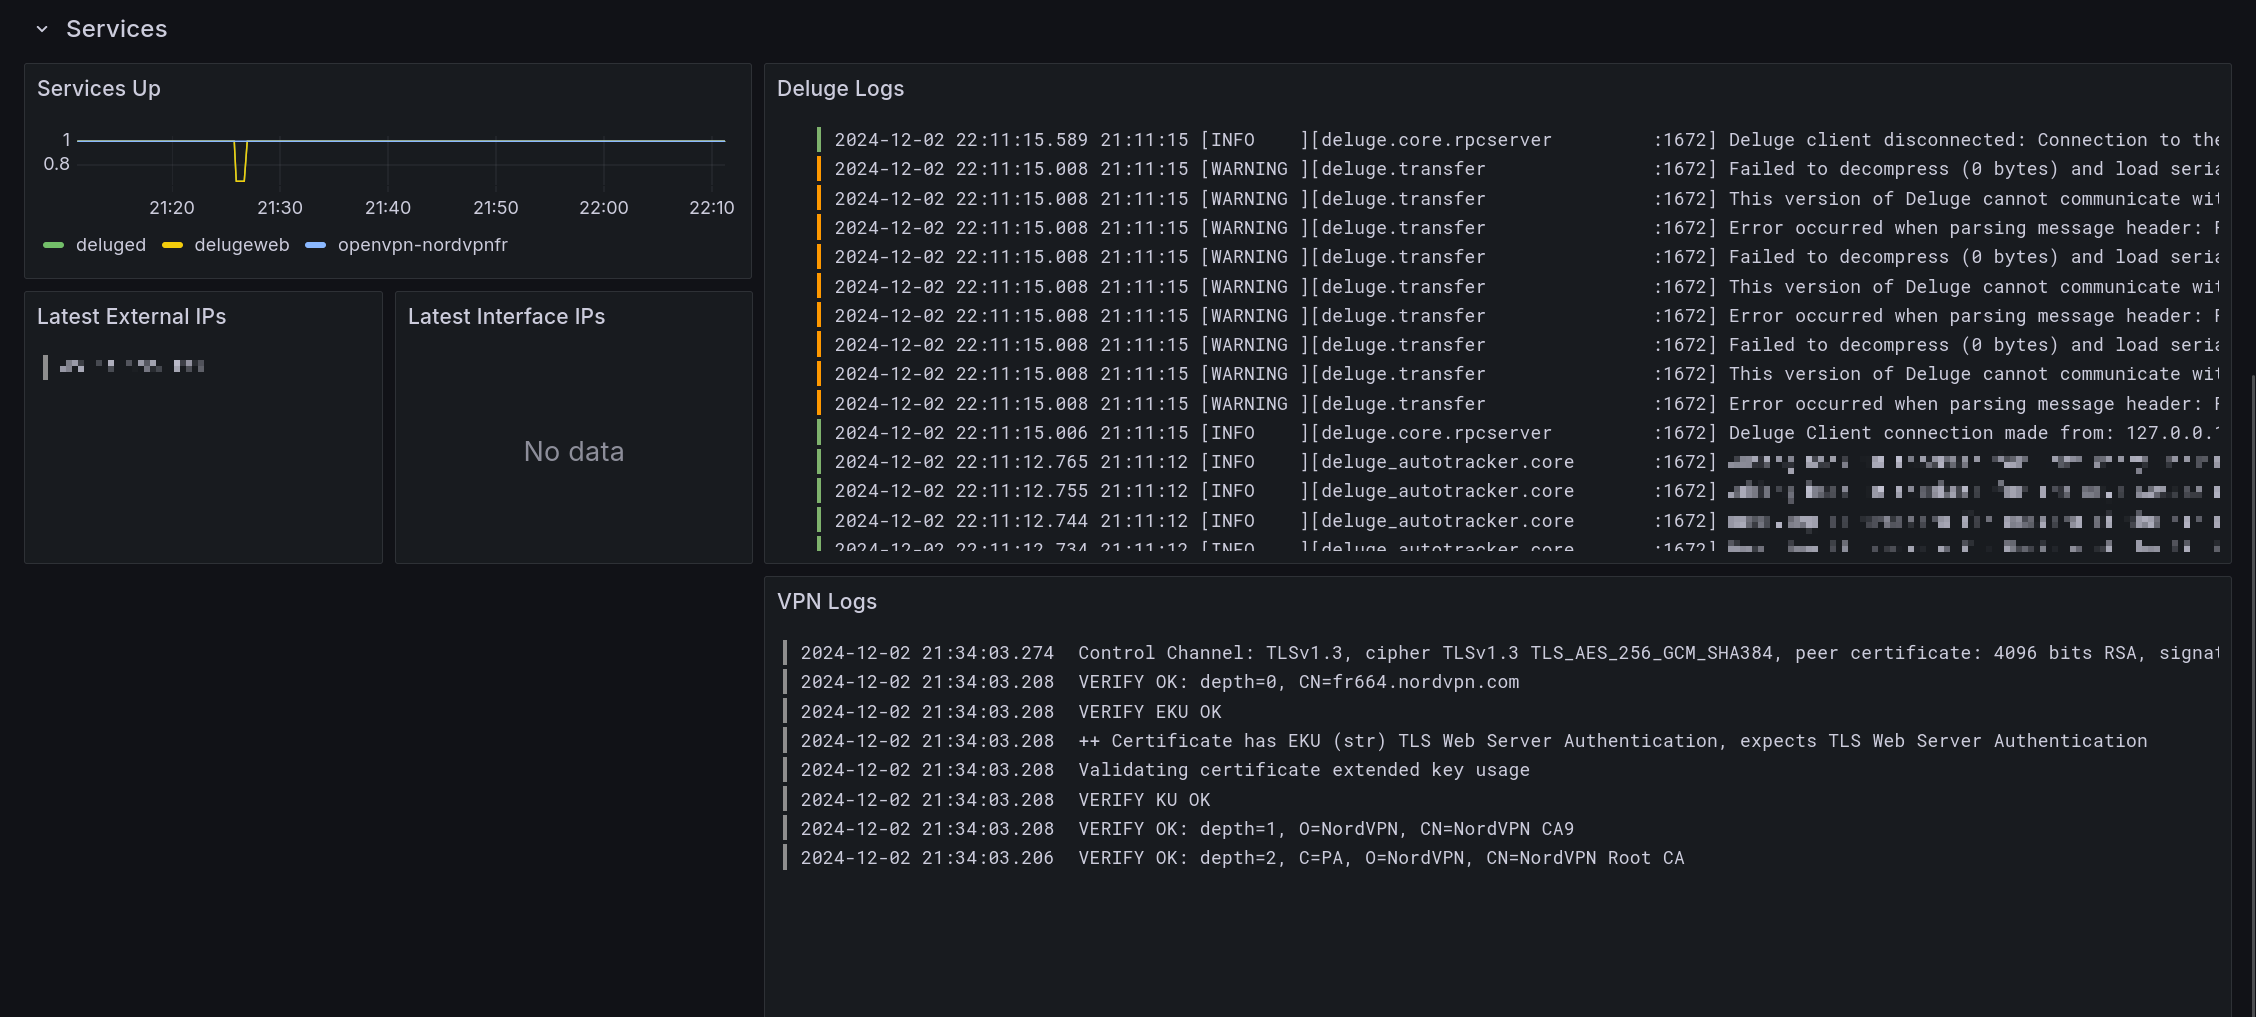
Deluge Dashboard
This dashboard is used to monitor a deluge instance.
Requests Error Budget Alert
This alert will fire when the ratio between number of requests getting a 5XX response from a service and the total requests to that service exceeds 1%.


Options Reference
id-prefix: blocks-monitoring-options-
list-id: selfhostblocks-blocks-monitoring-options
source: @OPTIONS_JSON@