 cbff4ab073
Salter-Harris I–V, the parabolic profile and its two lanes, the conducting and
respiratory zones, the four types of respiratory failure, and the mole as the
bridge between one atom and a weighable mass. Each is in the image bank with a
title, a description and a source, and embedded in the article it explains — so
it behaves like every other figure: a thumbnail in the prose, the full view on
a click, findable by what it shows.

Drawn as SVG and not generated as pictures, for two reasons. A schematic has to
have every label exactly right and stay right at any size, and one assembled
from shapes is corrected by editing a line rather than by rolling the dice
again. And a generated raster of anything clinical would be a fabrication
dressed as evidence, which is the one thing a teaching figure must never be.

The sources are kept here beside the docs because they are text, and text
belongs in the repository where it can be diffed.

Co-Authored-By: Claude Opus 5 <noreply@anthropic.com>
Claude-Session: https://claude.ai/code/session_01TqXevQJhxFrM7jJg82cgZN
40 lines
2.2 KiB
XML
40 lines
2.2 KiB
XML

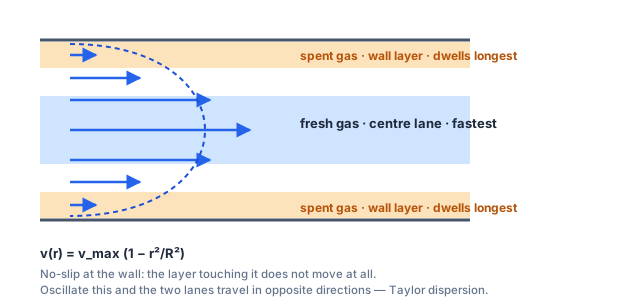


<?xml version="1.0" encoding="UTF-8"?>
|
||
<svg xmlns="http://www.w3.org/2000/svg" viewBox="0 0 620 300" role="img" aria-label="The parabolic velocity profile and radial sorting of gas in an airway">
|
||
<style>
|
||
.parabo-wall { stroke: #475569; stroke-width: 3; fill: none; }
|
||
.parabo-arrow { stroke: #2563eb; stroke-width: 2.5; marker-end: url(#tip); }
|
||
.parabo-fresh { fill: #bfdbfe; }
|
||
.parabo-spent { fill: #fcd9a5; }
|
||
.parabo-lab { font: 600 13px system-ui, sans-serif; fill: #1e293b; }
|
||
.parabo-sub { font: 11.5px system-ui, sans-serif; fill: #64748b; }
|
||
.parabo-mid { font: 600 12px system-ui, sans-serif; fill: #b45309; }
|
||
</style>
|
||
<defs><marker id="tip" viewBox="0 0 10 10" refX="9" refY="5" markerWidth="6" markerHeight="6" orient="auto"><path d="M0 0 L10 5 L0 10 z" fill="#2563eb"/></marker></defs>
|
||
|
||
<!-- The tube -->
|
||
<path class="parabo-wall" d="M40 40 H 470"/>
|
||
<path class="parabo-wall" d="M40 220 H 470"/>
|
||
<rect class="parabo-spent" x="40" y="42" width="430" height="26" opacity=".75"/>
|
||
<rect class="parabo-spent" x="40" y="192" width="430" height="26" opacity=".75"/>
|
||
<rect class="parabo-fresh" x="40" y="96" width="430" height="68" opacity=".75"/>
|
||
|
||
<!-- Velocity arrows: long in the middle, nothing at the wall. -->
|
||
<g class="parabo-arrow">
|
||
<path d="M70 55 H 96"/>
|
||
<path d="M70 78 H 140"/>
|
||
<path d="M70 100 H 210"/>
|
||
<path d="M70 130 H 250"/>
|
||
<path d="M70 160 H 210"/>
|
||
<path d="M70 182 H 140"/>
|
||
<path d="M70 205 H 96"/>
|
||
</g>
|
||
<path d="M70 44 C 250 44, 250 216, 70 216" fill="none" stroke="#1d4ed8" stroke-width="2" stroke-dasharray="5 4"/>
|
||
|
||
<text class="parabo-lab" x="300" y="128">fresh gas · centre lane · fastest</text>
|
||
<text class="parabo-mid" x="300" y="60">spent gas · wall layer · dwells longest</text>
|
||
<text class="parabo-mid" x="300" y="212">spent gas · wall layer · dwells longest</text>
|
||
|
||
<text class="parabo-lab" x="40" y="258">v(r) = v_max (1 − r²/R²)</text>
|
||
<text class="parabo-sub" x="40" y="278">No-slip at the wall: the layer touching it does not move at all.</text>
|
||
<text class="parabo-sub" x="40" y="294">Oscillate this and the two lanes travel in opposite directions — Taylor dispersion.</text>
|
||
</svg>
|
